Practical Takeaway TL;DR
If you only have 30 seconds, here is the whole argument. The rest of the post is the receipts.
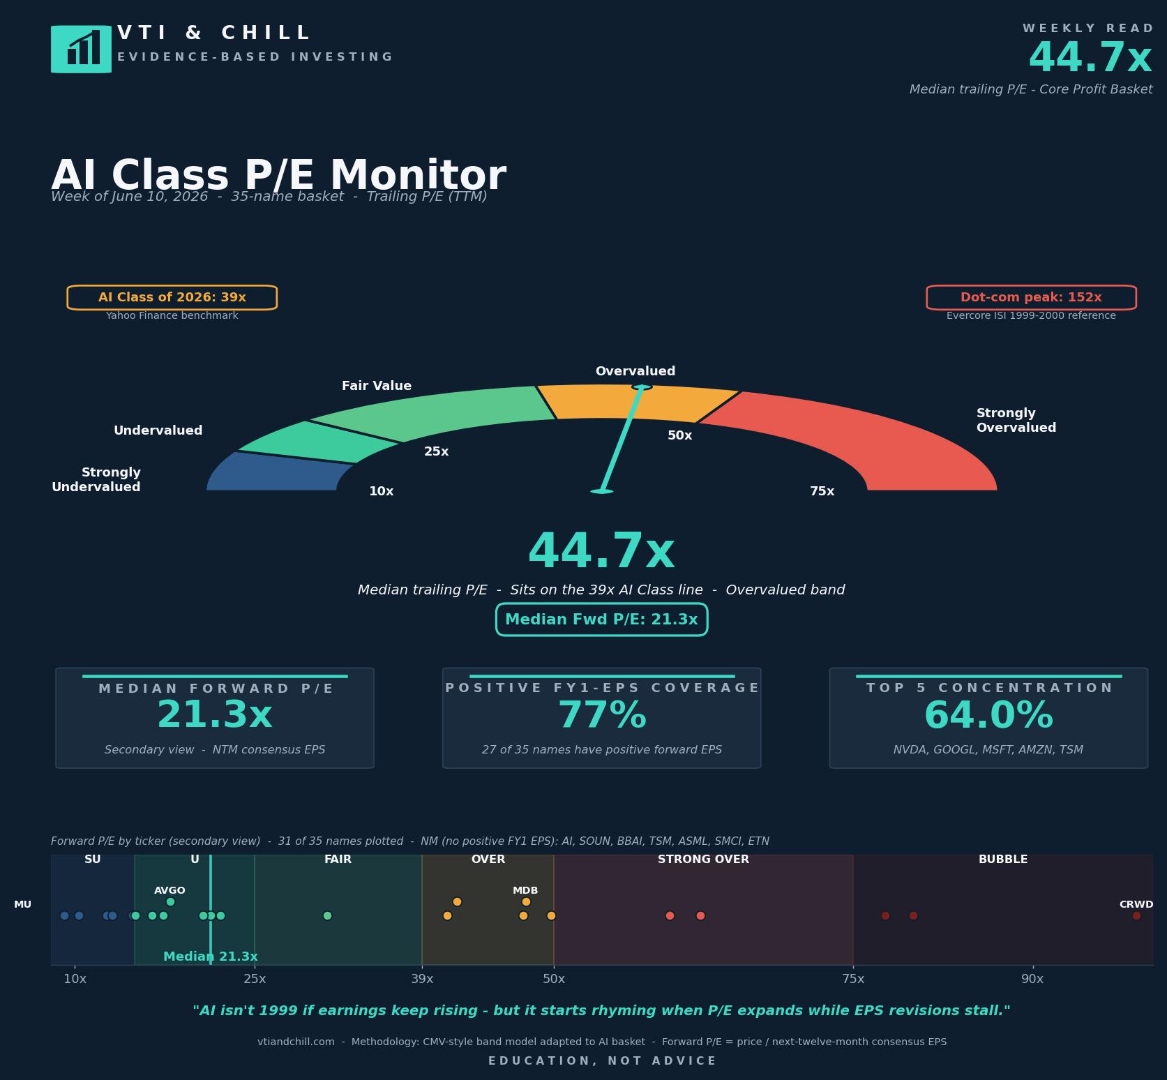
- The multiple gave back 6.6 turns in one week. Trailing P/E fell from 51.3x to 44.7x; forward P/E fell from 23.6x to 21.3x. That is healthy compression — not a crash, not a bubble pop, just the denominator doing its job.
- Breadth held at 77%. Twenty-seven of 35 names still have positive forward EPS — unchanged from last week. The compression came from price and EPS re-rating, not from coverage breaking. That is the key structural tell.
- Concentration ticked UP to 64.0%. The top-5 (NVDA, GOOGL, MSFT, AMZN, TSM) now account for 64 cents of every dollar in the basket, up from 61.8%. When the multiple cools but concentration rises, you are getting more AI exposure from fewer names — that is a portfolio risk, not a valuation one.
- We are now sitting on the 39x AI Class benchmark line. Above it is the overvalued band. Below it is fair value. This is the inflection point — not a buy signal, not a sell signal, but a rebalancing checkpoint.
- Action: keep DCAing, do not chase, rebalance the bands. Dollar-cost average the broad index. Trim any individual AI name that has drifted more than 5 percentage points or 25% above your target allocation. Do not rotate into the top-5 at 64% concentration just because the headline number got smaller.
Last week, the AI Class monitor logged its highest-ever trailing P/E reading: 51.3x. The inbox filled with 1999 comparisons. The finance influencers found their moment. And then — quietly, without any particular headline driving it — the basket gave back 6.6 turns in a single week.
That is not how bubbles end. Bubbles end with breadth breaking, revisions collapsing, and the forward multiple following the trailing one into the dirt. What happened this week is more mundane and more instructive: the denominator kept growing, prices softened modestly, and the forward P/E compressed from 23.6x to 21.3x alongside it.
There are now four things worth tracking in this week's monitor, and only one of them is good news about valuation. The others deserve just as much attention.
The Flinch: What 6.6 Turns in One Week Actually Means
A 6.6-turn drop in median trailing P/E is a large single-week move. To put it in context: the monitor jumped 9 turns the prior week going up. Giving back two-thirds of that in one week, without a corresponding collapse in earnings coverage, is the mechanical definition of healthy compression.
The mechanism matters. There are two ways a P/E can fall. The first is the bad way: prices drop and the denominator doesn't move, or prices hold and earnings get revised down — either way you're watching the multiple compress through deterioration. The second is the good way: earnings grow into the price, or prices soften modestly while forward estimates hold. This week's data points to the second mechanism. Forward P/E fell from 23.6x to 21.3x in parallel, which means both the numerator and denominator moved — not a one-sided crack.
This is exactly the kind of cooling that does not show up in the broad index headlines. The S&P 500 can drift sideways or mildly negative while the AI basket's multiple compresses 6.6 turns through a combination of modest price softening and continued earnings beats rolling through. The weekly P/E monitor exists to catch precisely these moves, which are invisible to anyone watching only the price tape.
Breadth Held: Why That Is the Structural Tell
Seventy-seven percent of names in the basket — 27 of 35 — still carry positive forward EPS. That number did not move from last week. The eight names without a positive FY1 EPS figure (AI, SOUN, BBAI, TSM, ASML, SMCI, ETN) represent the same coverage gap as the prior week. The compression did not eat into breadth.
This distinction matters enormously for the 1999 comparison that keeps circulating. In the dot-com setup, breadth narrowed first. The share of names carrying positive and stable forward earnings began deteriorating months before the price peak — estimates got cut, the denominator shrank, and the trailing P/E expanded mechanically as the forward number stopped making sense. The trouble showed up in breadth before it showed up in price.
At 77%, this basket has the same breadth it has carried for the past several weeks. A multiple that compresses while breadth holds is a very different signal than a multiple that expands while breadth erodes. The first is an asset class getting cheaper on a stable earnings base. The second is what happened in 1999.
Concentration Ticked Up: The Part Worth Watching More Than the P/E
Here is the uncomfortable number in this week's monitor: top-5 concentration went from 61.8% to 64.0%. NVDA, GOOGL, MSFT, AMZN, and TSM now account for 64 cents of every dollar of weight in the AI Class basket — even as the headline multiple compressed.
This is the counterintuitive part of a narrowing rally. When the multiple cools but the top-5 share rises, it means the compression is not evenly distributed across the basket. The smaller and mid-tier names gave back more ground, their weight shrank, and the large-cap names absorbed a larger share of the total. You now have a basket that is cheaper on the headline P/E but more dependent on five names than it was last week.
There is nothing automatically wrong with that. NVDA, GOOGL, MSFT, AMZN, and TSM are, by any reasonable measure, the companies most directly exposed to the AI infrastructure buildout with actual earnings to show for it. But concentration at 64% means your AI basket is not giving you the basket diversification the name implies. It is giving you a five-name bet with smaller satellites attached.
If you are using the basket as a diversified AI exposure vehicle, this reading is worth pausing on. The 5/25 rebalancing rule — trim when a position grows more than 5 percentage points or 25% above your target — was designed exactly for this scenario.
"AI isn't 1999 if earnings keep rising — but it starts rhyming when P/E expands while EPS revisions stall."
That is the headline from this week's monitor chart, and it is worth taking literally. The bubble pattern has two required ingredients, not one. P/E alone is not the signal — the signal is P/E expanding while earnings revisions stall or turn negative. We have neither condition right now. Forward P/E fell this week. Breadth held. The denominator is still growing. The rhyme with 1999 requires both ingredients to show up together, and they haven't.
The 39x Line: We Just Touched the Benchmark
The AI Class of 2026 benchmark sits at 39x trailing P/E. Above it is the overvalued band; below it is the fair-value band. At 44.7x, we are 5.7 turns above the line — but we are the closest we have been to it since the monitor started logging readings above 40x.
Sitting on or near the 39x line is not a buy signal. It is a rebalancing checkpoint. The 152x dot-com peak, as reconstructed by Evercore ISI's analysis of the 1999–2000 darlings basket, is still more than three times away. We are not approaching 1999 territory. But we are in the range where a moderate further compression — another 5–7 turns — would flip the monitor from "overvalued" to "fair value" on this metric.
What would drive that? Another week or two of earnings beats where the denominator catches up further, modest price softening in the top-5, or some combination. None of that requires a crisis. It requires the market to keep doing what it did this week: letting the multiple breathe.
What a Real Bubble Would Do
The bubble pattern that preceded 2000 had a specific shape. Prices ran ahead of any plausible forward earnings number. Estimates got revised down even as prices held or rose. The forward P/E became disconnected from the trailing one — not because earnings were growing, but because analysts kept issuing optimistic forward numbers that the trailing earnings never validated. Eventually the trailing number exploded as earnings collapsed and the price didn't follow fast enough on the way down.
The 2026 monitor shows the opposite structure. Forward P/E fell to 21.3x this week — only modestly above the broad S&P 500's forward multiple. The trailing-to-forward gap is 23.4 turns (44.7x trailing minus 21.3x forward). When that gap closes through earnings growth rather than price collapse, you have a working thesis, not a bubble.
The names in the monitor that remain without positive FY1 EPS coverage — AI, SOUN, BBAI, and others — are the ones where the 1999 pattern could apply locally. Small model-layer names with no current earnings, priced on narrative. Those are worth watching individually. They are not the basket.
Get this week's spreadsheet
Track the AI Class P/E Monitor yourself. We update every Tuesday after close — trailing P/E, forward P/E, breadth, concentration, and individual ticker bands. Make your own copy and follow along in real time.
Download the AI P/E Monitor (Google Sheets) →The Ticker Band Read: Where Individual Names Sit
The forward P/E scatter strip in this week's monitor plots 31 of the 35 names. The four without a positive FY1 EPS (AI, SOUN, BBAI, and one other) don't generate a clean forward multiple, so they are excluded from the strip but still count toward breadth coverage.
The band read this week:
- MU (Micron): Undervalued band. Forward earnings are being revised up on memory cycle tailwinds. This is the name that looks cheapest on a pure forward P/E basis in the basket.
- AVGO (Broadcom): U band (lower end of fair value). Custom AI silicon and networking revenue have earned it a mid-range forward multiple.
- MDB (MongoDB): Overvalued band. Developer-layer infrastructure at a premium to the basket. Not a bubble, but priced for continued execution.
- CRWD (CrowdStrike): Bubble band. Cybersecurity-AI convergence at multiples that embed many years of compound growth. Not impossible, but the margin for error is thin.
The spread from undervalued (MU) to bubble band (CRWD) is exactly why a basket median P/E is a useful summary stat but a dangerous single decision variable. At 44.7x median, you are averaging across a genuine bargain and a high-conviction growth bet in the same number.
The Boring Playbook (Still the Right One)
Nothing in this week's data changes the mechanical playbook. The multiple gave back 6.6 turns — that is mildly encouraging. Breadth held — that is the structural anchor. Concentration ticked up — that is the one to watch. The 39x line is close but not crossed.
The action items remain what they always have been:
- Keep dollar-cost averaging the broad index. VTI, VXUS, the whole market. The AI Class basket is inside that; you are already long these names at market weight. The monitor is for awareness, not for tactical rotation.
- Use the rebalance bands. If any individual AI name has grown to more than 5 percentage points above your target allocation, or grown more than 25% above that target, trim. That rule exists precisely for weeks when concentration rises even as the headline P/E falls.
- Do not chase the top-5 because the number got smaller. NVDA, GOOGL, MSFT, AMZN, and TSM at 64% concentration are not cheaper because the basket median compressed. They are more concentrated. Cheaper median P/E with higher concentration is not an invitation to buy more of the names driving concentration.
- Watch revisions, not levels. The 1999 signal showed up in revision direction before it showed up in prices. If forward EPS for the AI basket starts getting cut while prices hold, the gap between trailing and forward widens for the wrong reason. That is the tell. It is not happening yet.
The Bottom Line
The AI Class basket gave back 6.6 trailing P/E turns in one week — from 51.3x to 44.7x. Forward P/E fell to 21.3x. Breadth held at 77%. Concentration rose to 64.0%. We are now sitting on the 39x AI Class benchmark line — the closest we have been to fair-value territory in recent weeks. None of this is a bubble signal. The bubble pattern requires P/E expanding while EPS revisions stall; we have compression and stable breadth instead. The honest read: the basket is getting cheaper on a stable earnings base, but the top-5 concentration is rising, which means your effective AI exposure is narrowing even as the headline number improves. Keep DCAing the broad index. Use the rebalancing bands. Do not treat a smaller P/E number as a green light to load up on the names that just drove concentration to 64%.
Disclaimer: VTI & Chill provides financial EDUCATION, not personalized financial ADVICE. We are not licensed financial advisors. All content is for informational and educational purposes only. Past performance does not guarantee future results. Always do your own research and consider consulting a qualified financial professional before making investment decisions. All investing involves risk, including the possible loss of principal.