Every time the AI Class trailing P/E jumps a few turns, the same headline writes itself. Investors who lived through 1999 raise an eyebrow. The CNBC chyron flashes some version of "bubble territory." A finance influencer posts a side-by-side of Cisco and NVIDIA, and a half-million people decide they have done the work.
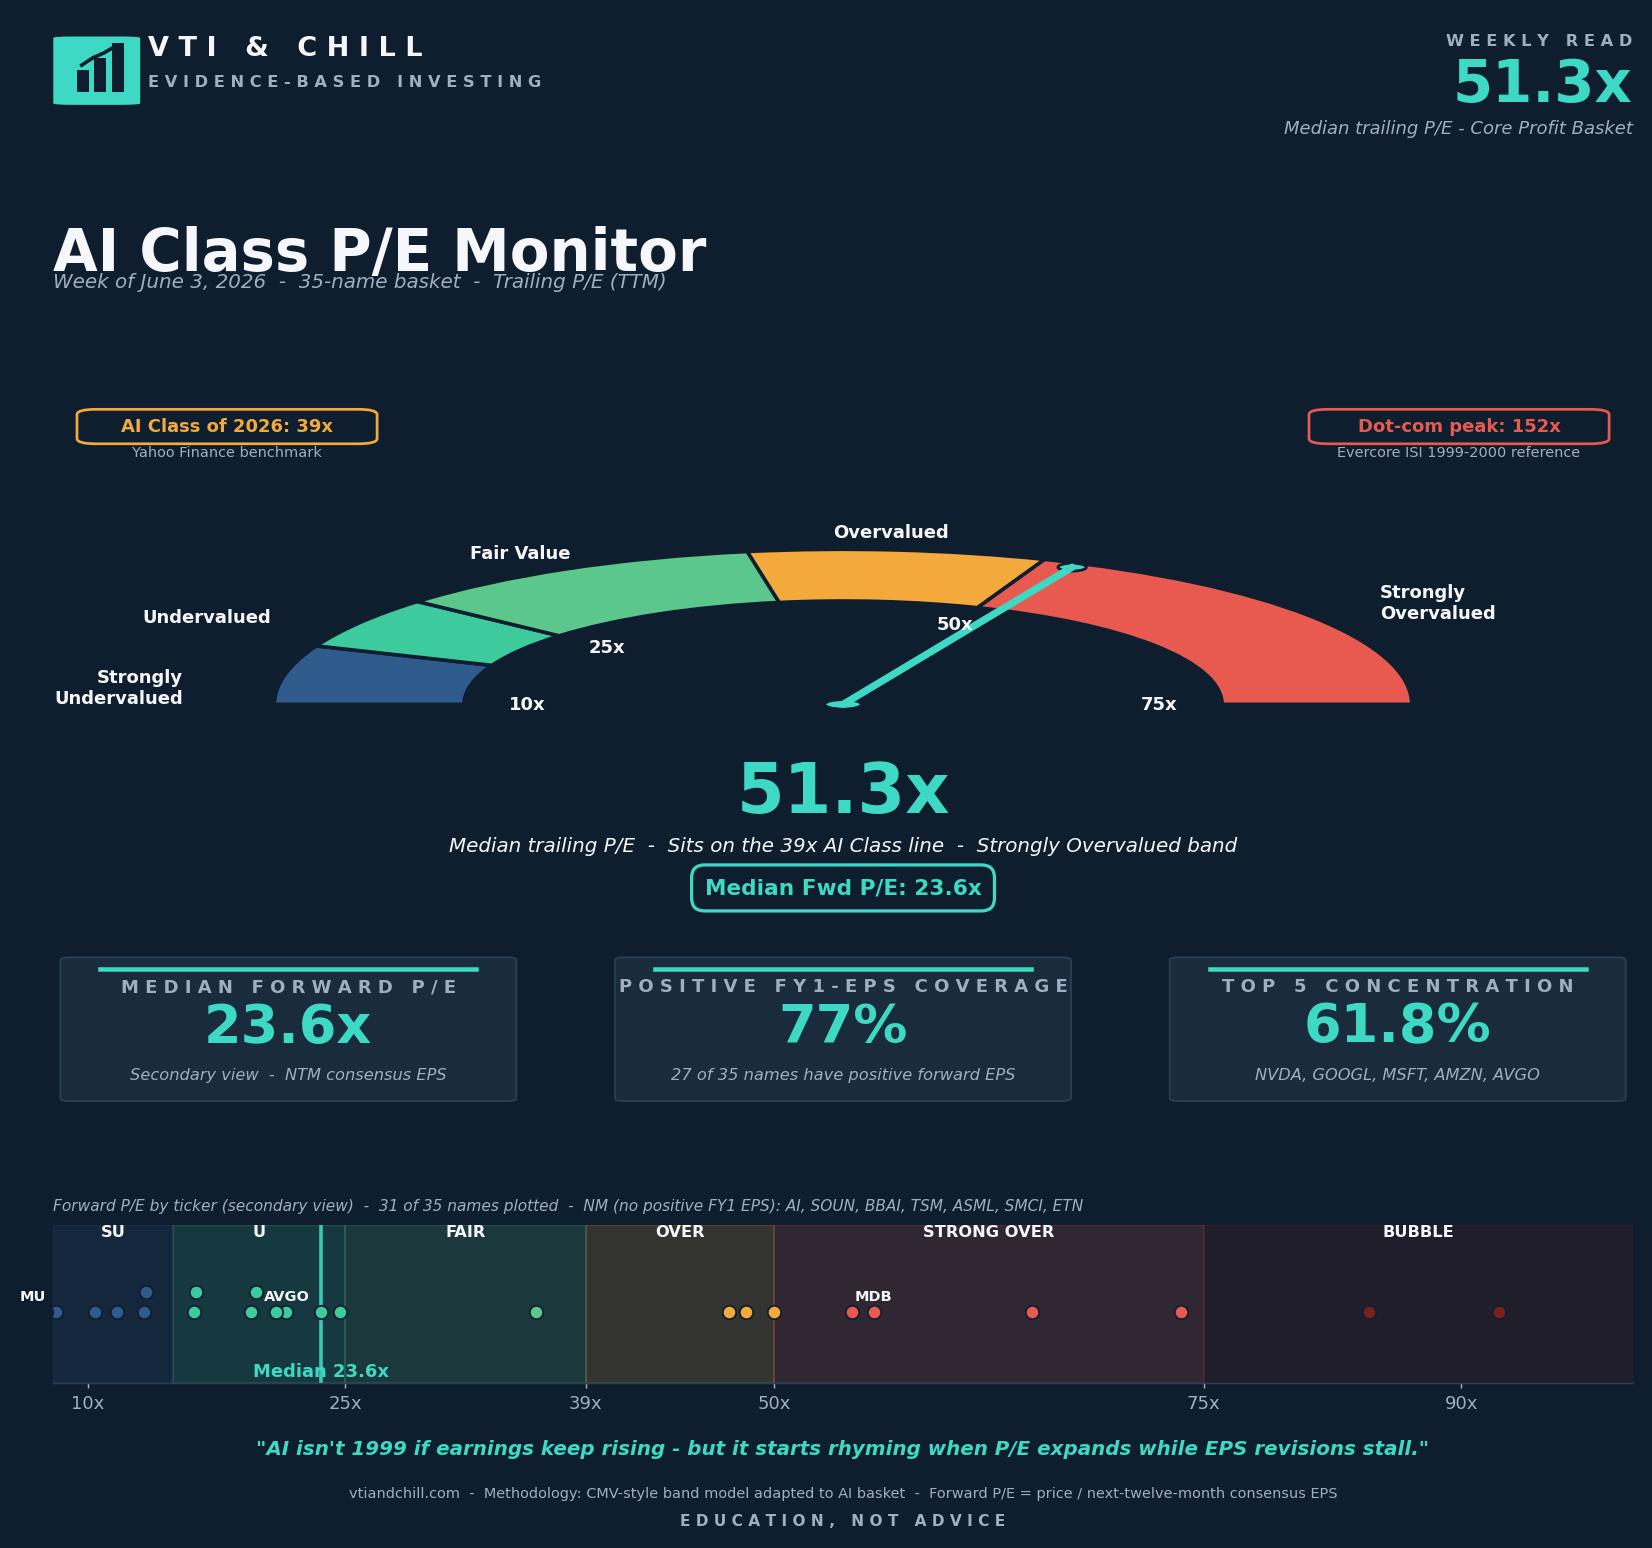
This week, the AI Class median trailing P/E jumped from 42.2x to 51.3x. A nine-turn move in seven days. Forward P/E barely budged — it rose 1.8 turns to 23.6x. The gap widened sharply. And the comparisons to 1999 started landing in my inbox before I had finished my coffee.
Here is the problem with most of those comparisons. They are vibes-based. They pattern-match on the shape of the chart rather than what is happening inside the companies. They treat "expensive" and "1999" as synonyms, when the actual mechanics of 1999 — what people paid, what earnings did, what the cash flows looked like — were dramatically more extreme than anything in the current basket.
That does not mean today's AI Class is cheap. It is not. 51.3x trailing is the highest reading the monitor has logged. The forward number is closing the gap to the S&P 500's forward 12-month P/E of 20.9x, but the AI Class still trades at a meaningful premium to the index.
The honest answer is that "AI is in a bubble" and "AI is not in a bubble" are both wrong framings. The right question is more boring: how does the 2026 picture actually compare to 1999, on the numbers that matter?
The Practical Takeaway
If you only have 30 seconds, here is the whole argument. The rest of the post is the receipts.
- Watch earnings revisions, not P/E levels. In 1999, P/E expanded while revisions stalled and then turned negative. The signal of trouble was revision direction, not multiple absolute. If forward EPS for the AI Class starts getting revised down while prices hold, the gap widens for the wrong reason.
- Separate the picks-and-shovels from the customers. NVIDIA and the hyperscalers are reporting record margins. The open question is the corporate-AI demand layer — whether the customers of the hyperscalers extract enough productivity to justify the spend. Read Cembalest's COVIDIA piece once a quarter and re-anchor.
- Notice when forward and trailing converge. Today, the AI Class trades at 51.3x trailing and 23.6x forward — a 28-turn gap. When that gap closes by analysts cutting forward estimates, you have a real problem. When it closes by trailing earnings catching up, you have a working thesis.
- Compare margin structure, not just multiples. The 1999 darlings traded at 100x+ multiples on margins that were eroding. The 2026 AI Class trades at 51x trailing on 29.1% information-technology sector margins that are the highest FactSet has ever logged. Margin direction matters at least as much as the multiple.
- Stay in the market. None of this is a buy or sell signal. Markets time poorly even when the diagnostics are correct. The historical record is clear: investors who try to dodge expensive periods by sitting in cash almost always miss the recovery on the other side, and miss the compounding in the middle.
The Numerator Side: What People Paid in 1999
The benchmark people reach for most often is the dot-com darlings basket. Evercore ISI's reconstruction of that basket hit a median trailing P/E of roughly 152x at the 1999–2000 peak. The S&P 500 itself peaked at about 30x trailing in early 2000, but the tech-heavy darlings basket — the names everyone was actually buying — trailed at multiples that look almost impossible from here.
Some individual examples are sharper. Cisco peaked in March 2000 at a market capitalization of roughly $555 billion and a forward P/E above 130x. Michael Cembalest has noted that Cisco's share price ran far ahead of its one-year forward EPS in the late 1990s — the surge in price was simply not matched by a surge in earnings. The denominator never caught up. The price came down to meet the denominator instead.
Today's AI Class sits at 51.3x trailing. That is roughly 3x below the 152x dot-com darlings peak. NVIDIA — the single name most often compared to Cisco — trades at 34x trailing this week. Cisco at its 2000 peak was multiples higher than that, on earnings that were already showing strain.
The numerator side gets attention because high P/E numbers make good television. But it is the easier side of the analysis. Multiples are observable. The harder and more important comparison is what was happening underneath the prices.
The Denominator Side: What Earnings Actually Did
This is where the 1999 vs. 2026 comparison breaks most clearly.
In 1999, a meaningful share of the dot-com darlings had either no earnings or earnings that were rapidly deteriorating. Many companies were valued on revenue multiples, eyeballs, page views, or other narrative metrics because there was nothing else to value them on. Forward earnings estimates kept getting revised down even as prices climbed. The denominator was getting smaller while the numerator got bigger. The result was a P/E that exploded mathematically, not from analyst optimism but from earnings disappointment.
The 2026 picture is the opposite. According to FactSet's most recent Earnings Insight, the S&P 500 information technology sector reported a Q1 2026 net profit margin of 29.1%, up from 25.4% a year earlier — the highest level since FactSet began tracking the metric in 2009. Tech-sector net profit margins are running more than double the broad S&P 500 average, according to JPMorgan's 2026 Investment Outlook.
That same JPMorgan analysis puts the framing as starkly as it can be put: "Unlike in the late 1990s, when valuations surged while earnings lagged, today's run-up in share prices has been driven far more by expanding earnings."
This week's monitor shows 77% of basket names earning positive forward EPS — 27 of 35 names. The eight names without positive forward EPS skew toward smaller model-layer and infrastructure names where consensus has not yet established a clean forward number. In 1999, the equivalent share of profitable names in the dot-com darlings basket was a fraction of that.
The shape that fools the chart-overlay people
When the denominator is growing, a high trailing P/E mechanically compresses with time — the earnings catch up to the price and the ratio falls even if the stock doesn't move. When the denominator is shrinking, a high trailing P/E expands for the opposite reason — earnings collapse beneath a price that hasn't fallen yet. Those two completely different markets happen to produce similar-looking price charts on a short time horizon, which is exactly why the 1999 vs. 2026 overlay keeps surfacing and keeps misleading.
The Capex Question — Where 1999 and 2026 Actually Rhyme
If there is one place the comparison has real teeth, it is on capital spending.
Cembalest's JPMorgan analysis walks through the parallel directly. NVIDIA's data center revenues have approached roughly 15% of all market-wide capital spending. That level of single-company capex concentration has occurred only twice before in the post-war era — once in 1969 with IBM at the peak of the mainframe era, and once in 2000 with Cisco, Lucent, and Nortel at the peak of the fiber buildout. Both prior episodes ended with painful capex digestion cycles.
The Sequoia Capital analysis Cembalest references is worth sitting with. Roughly $600 billion of data center spend was committed against an estimated $100 billion in revenues earned on that spend. The gap — the missing $500 billion that has to show up somewhere to justify the buildout — is the open question of the AI cycle.
This is a 2026 problem, not a 1999 problem. The companies building the infrastructure are profitable. The companies buying the infrastructure are mostly profitable. The question is whether the customers of the customers — the corporate-AI adoption layer — generate enough productivity to amortize the capex.
That is a forward-earnings question. And forward earnings are what the 23.6x forward P/E is actually pricing.
Get the spreadsheet
Want to track this yourself? We update the AI Class P/E Monitor every Tuesday after close. Make your own copy in Google Sheets, update the constituents and inputs each week, and you'll see the trailing-vs-forward gap evolve in real time. Copy the spreadsheet
The Bottom Line
The AI Class trailing P/E sits at 51.3x this week, up nine turns from last week, and the 1999 comparisons are doing a roaring trade. They are also, on the actual numbers, mostly wrong. The 1999 dot-com darlings traded at roughly 152x trailing on shrinking earnings and a margin structure that was already breaking. The 2026 AI Class trades at 51.3x trailing on the highest information-technology net profit margins FactSet has ever recorded, with 77% of basket names earning positive forward EPS and a forward P/E that is only 2–3 turns above the broader S&P 500. The real risk in the current cycle is not multiple compression to 1999 levels — it is whether the corporate adoption layer generates the productivity needed to amortize the $600 billion in AI capex already committed. That is a question worth watching, but it is a different question than the one the 1999 chart-overlay implies. The honest read is that AI is expensive, earnings are real, capex is the wild card, and the only thing that ages worse than a bubble call is a bubble call grounded in the wrong year's data.
Disclaimer: VTI & Chill provides financial EDUCATION, not personalized financial ADVICE. We are not licensed financial advisors. All content is for informational and educational purposes only. Past performance does not guarantee future results. Always do your own research and consider consulting a qualified financial professional before making investment decisions. All investing involves risk, including the possible loss of principal.