Every earnings season, millions of investors do the same thing: they watch the beat-rate headlines, see CNBC declare a "strong quarter," and make a mental note that earnings are good, so the market should keep going up. This behavior feels like paying attention. It is also almost entirely the wrong thing to track.
The number that actually moves forward returns, compresses multiples, and drives the entire forward-P/E machinery Wall Street uses to price stocks — is not the absolute earnings number. It is how that number is changing. This week's S&P 500 data is one of the cleanest examples in years of why the distinction matters, and it has direct implications for the AI Class basket I track every week.
The 14-Day Revision That Should Get More Attention
For roughly twelve months — May 2025 through April 2026 — the consensus Q1 2026 EPS estimate for the S&P 500 sat at approximately $72. Then in two weeks, between late April and May 12, 2026, it jumped to $80.29. That is an 11–12% revision in the bottom-up estimate over fourteen days.
The chart this revision appeared on, courtesy of FactSet, was titled "Strong Earnings Growth Has Supported Stocks." That title is technically defensible but practically misleading. The chart does not show earnings growing in real time. It shows the consensus forecast catching up to actuals as Q1 2026 reports rolled in. Companies didn't grow 11% overnight. Analysts just got a lot less wrong — because AI capex is flowing into vendor revenue faster than the consensus modeled.
According to FactSet's May 8 earnings season update, the blended Q1 2026 earnings growth rate climbed from 13.1% on March 31 to 27.7% by May 8 — a jump of 14.6 percentage points in five weeks. The 10-year average for that same quarter-end-through-end-of-season rise is +5.8 points. The 5-year average is +7.0 points. This quarter is running roughly 2x the 10-year norm. Companies are also beating estimates by 18.2% in aggregate vs. a 5-year average of 7.3% — about 2.5x the typical magnitude of beat.
That is not a normal earnings cycle. That is something different happening underneath.
What Revisions Actually Tell You
Earnings, in isolation, are a snapshot of the past. A company reports Q1, and Q1 is over. The number tells you what already happened in a window that is already closed.
Earnings revisions are different. Revisions are the moment professional analysts admit, in writing, that their last forecast was wrong. They are forward-looking by construction. When the consensus forecast moves, it is because the people whose job is to predict next quarter just adjusted what they think next quarter looks like.
This is why every analyst report leads with forward P/E rather than trailing P/E. Wall Street does not price stocks on what companies earned last quarter. It prices them on what it thinks they'll earn in the next twelve to eighteen months. The arithmetic is simple: if the price stays where it is and the E in the denominator goes up, the P/E mechanically comes down. No selling required. No narrative shift required. Just earnings showing up where analysts now expect them to.
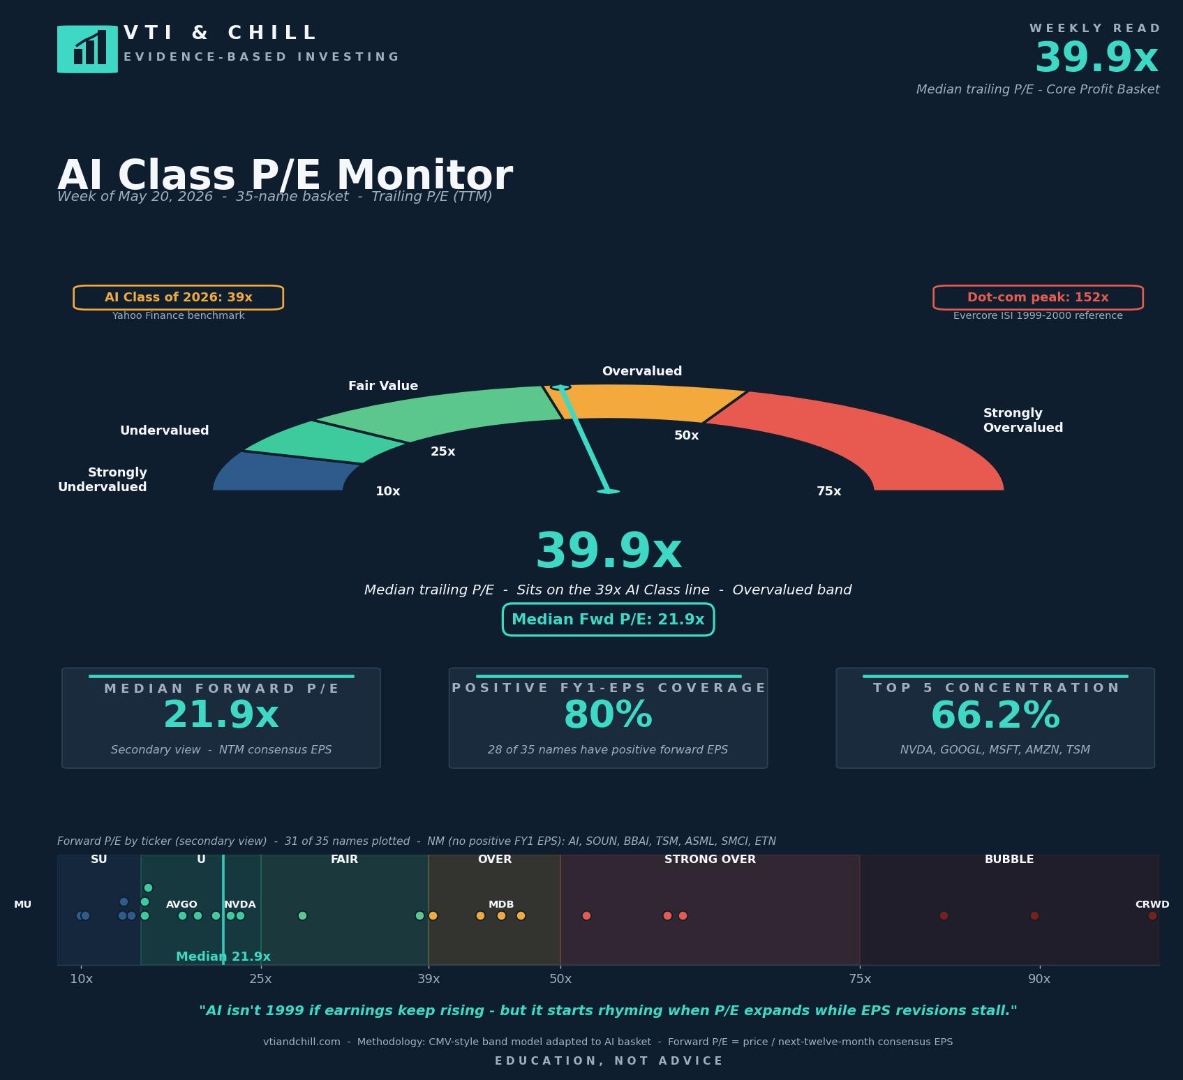
This is the entire reason the AI Class basket I track shows a 39.9x trailing P/E and a 21.9x forward P/E at the same time. Forward earnings are expected to nearly double trailing earnings over the next twelve months. If analysts are right, today's "expensive" basket compresses to something that looks ordinary on its own. If analysts are wrong, multiples don't get rerated through patience — they get repriced through selling.
The direction of revisions tells you which scenario is more likely.
How This Quarter Compares to Bubbles and Normal Cycles
There are essentially three regimes for earnings revisions, and each implies a different valuation outcome.
In a normal cycle, the quarterly growth rate rises 5 to 7 percentage points from quarter-end through the end of reporting season. Companies beat estimates by 5 to 7% in aggregate. Forward earnings climb modestly. Multiples drift sideways or compress slightly.
In a deteriorating cycle, the quarterly growth rate falls during the reporting window as misses pile up. Forward EPS estimates get cut. The P/E ratio "expands" not because prices rose but because the E shrank. This is the regime that actually rhymes with 1999. The dot-com peak wasn't just a 152x trailing P/E on Evercore ISI's dot-com darlings basket. It was a 152x trailing P/E paired with collapsing forward estimates as capex assumptions broke and revenue failed to materialize.
In an accelerating cycle — which is where the data currently lives — the quarterly growth rate rises 2x to 3x the historical norm. Companies beat estimates 2x to 3x harder than usual. Forward EPS estimates climb sharply. Multiples compress mechanically because the denominator is moving faster than the numerator.
The AI Class basket sitting at 39.9x trailing and 21.9x forward is the visible artifact of regime three. The S&P 500 broadly trading around 31x trailing on the back of a 14.6-point quarterly revision is the same artifact at index level.
An honest caveat on forward P/E
Forward P/E only protects you if the revisions don't reverse. They have before. Bubbles don't break because trailing multiples look high — they break when forward earnings stop showing up. If AI capex cycles stall, if enterprise software renewal rates disappoint, or if macro headwinds compress the estimates that are currently expanding, this whole compression thesis runs in reverse. The data today argues against that scenario. It does not make it impossible.
This does not make either basket "cheap." It makes the bear case harder. The bear case now has to argue that revisions reverse, capex stalls, or both. It can no longer simply argue that the trailing multiple "looks high." Those are different arguments with different probabilities.
The Practical Takeaway
None of this means you should chase AI exposure or overweight any sector based on a single earnings cycle. Revisions can flip in either direction in any given quarter, and a strong reporting season does not guarantee a strong forward return. JL Collins put it well in The Simple Path to Wealth: you don't need to understand every market mechanism to benefit from it. You just need to stay in the market.
But for a long-term investor watching the AI valuation debate, the revision data changes which questions actually matter:
- Track the forward number, not just the trailing number. A 39x trailing P/E in isolation tells you almost nothing about whether you're paying too much. Pair it with the forward number and the gap between them does most of the explanatory work.
- Track revisions, not just beats. A "beat" tells you a company exceeded a forecast. A revision tells you analysts now expect a higher run rate going forward. Beats happen every quarter. Revisions of this magnitude do not.
- Calibrate against history. FactSet publishes 5-year and 10-year averages for every metric that matters. A jump from 13.1% to 27.7% sounds dramatic — and it is — but only because you can compare it to the +5.8-point 10-year average. Without the calibration, every quarter sounds the same.
- Read chart titles skeptically. "Strong Earnings Growth Has Supported Stocks" is not the same statement as "Strong Earnings Growth Is Currently Happening." One is observed in retrospect. The other is observed in revision data. Treat them as different objects.
- Keep showing up. Owning a broad index like VTI means you already own all of this — the revisions, the multiples, the AI capex flow-through, and the analysts updating their forecasts every Friday. You don't have to predict the next revision cycle. You just have to keep buying the whole market through every cycle. That's the whole game.
The Bottom Line
The AI Class is expensive on a trailing basis and merely full on a forward basis, and the gap between those two numbers is being driven by a 14.6-point quarterly earnings revision running roughly 2x the 10-year average. Companies are beating estimates by 18.2% — about 2.5x the 5-year norm — and the bottom-up Q1 EPS estimate jumped from $72 to $80.29 in two weeks because AI capex is flowing into vendor revenue faster than the consensus modeled. That doesn't make the basket cheap, and it doesn't guarantee multiples keep compressing. But it does mean the bear case has shifted from "P/E looks high" to "revisions have to reverse." Those are different arguments with different probabilities. The number that matters for forward returns is not what companies earned last quarter. It is whether the people paid to predict earnings are getting more wrong or less wrong over time. Right now, in this cycle, they are getting substantially less wrong — and VTI holders are already along for the ride whether they check the revision data or not.
Disclaimer: VTI & Chill provides financial EDUCATION, not personalized financial ADVICE. We are not licensed financial advisors. All content is for informational and educational purposes only. Past performance does not guarantee future results. Always do your own research and consider consulting a qualified financial professional before making investment decisions. All investing involves risk, including the possible loss of principal.