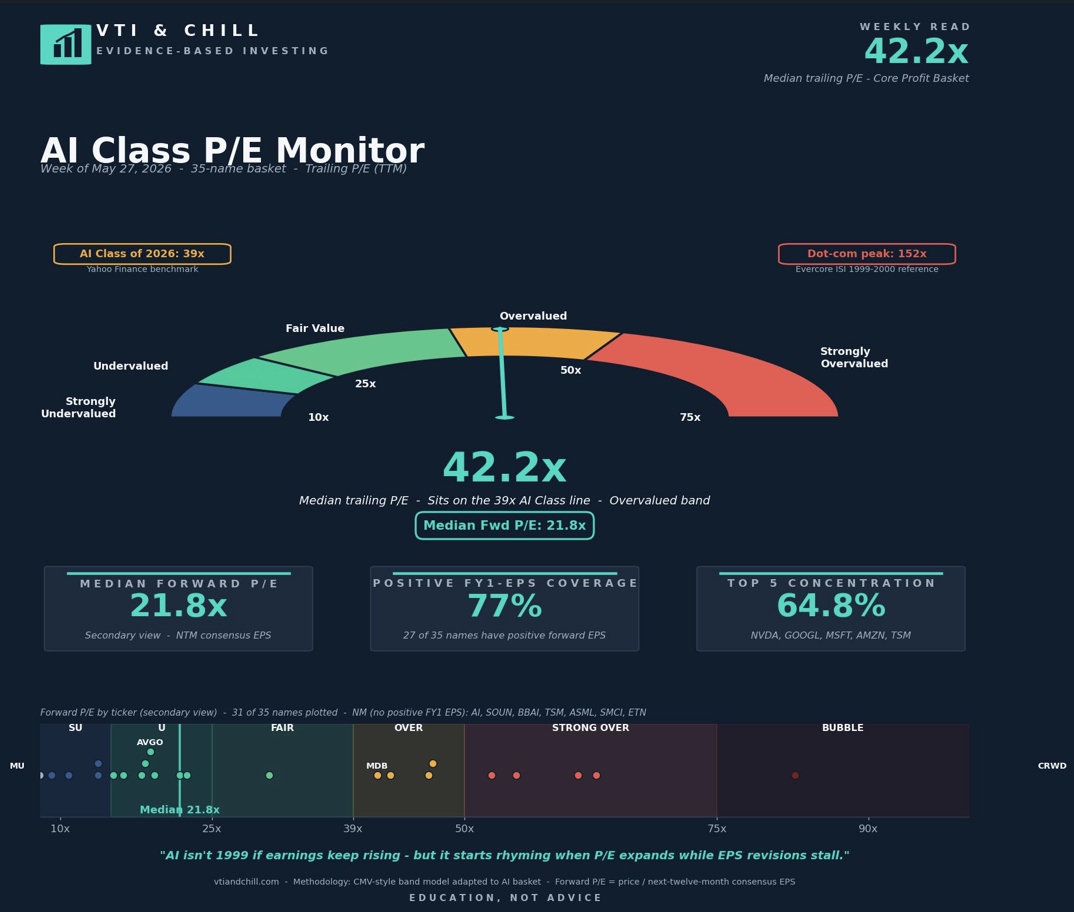
Every week, somebody on financial television holds up a chart of the AI sector's trailing price-to-earnings ratio and says some version of the same thing. The number is high. The number is higher than the S&P 500. The number is heading in the wrong direction. Therefore, the market is dangerous.
This commentary feels rigorous. It feels like the speaker has done the math. It feels like a serious warning from a serious person.
It is also, in most cases, a deeply incomplete view of what a P/E ratio actually tells you. The trailing number describes what an investor paid for the last twelve months of earnings. The forward number describes what an investor is paying for the next twelve months. Those are wildly different questions, and the answers diverge most sharply during exactly the kind of fast-earnings-growth environment the AI Class is in right now.
This week's AI Class P/E Monitor sits at a 42.2x trailing P/E and a 21.8x forward P/E. The gap between those two numbers — almost 20 full turns — is not a quirk. It is the entire story.
If you want to understand whether AI stocks are expensive, you have to understand which year of earnings sits in the bottom of the fraction.
The Practical Takeaway
If you only have 30 seconds, here is the whole argument. The rest of the post is the receipts.
- Always look at trailing and forward P/E together. Never one alone. The gap between them is information.
- Compare like to like. The S&P 500 forward P/E is 20.9x. The AI Class forward P/E is 21.8x. That is a far narrower premium than the trailing comparison suggests.
- Watch the earnings revisions trend. A rising forward number with a falling trailing number means analysts are catching up to actuals. A rising trailing number with a flat or falling forward number means the price is getting ahead of the estimates.
- Treat any single-stock P/E above ~100x with extra skepticism, especially when it is being justified by "the forward number." Forward estimates can be wrong, and they are most often wrong on the highest-multiple names.
- Do not let one number make the decision. The headline trailing P/E is the laziest possible read on whether a basket is expensive. The full picture lives in the spread.
What a P/E Ratio Actually Measures
Strip away the jargon and a price-to-earnings ratio is one equation: P/E = Price per share / Earnings per share.
The numerator — price — moves every second the market is open. It reflects expectations, sentiment, flows, and the marginal trade. The denominator — earnings — moves four times a year when a company reports.
That asymmetry creates two completely different P/E ratios for the same company at the same moment in time. The trailing P/E uses the most recent four quarters of reported earnings as its denominator. The forward P/E uses the next four quarters of expected earnings, drawn from analyst consensus estimates.
For a slow-growing utility, the two numbers are nearly identical. For a company growing earnings 30% year over year, the forward number can be a third lower than the trailing one — without anything changing about the price.
According to the most recent FactSet Earnings Insight, the S&P 500 forward 12-month P/E is 20.9x, against a trailing P/E that sits closer to 31x. That gap, mechanically, tells you analysts expect the index's earnings to climb roughly 21% over the next year. The trailing number is the bill for last year. The forward number is the bill for next year.
This week's AI Class basket has the same gap, only bigger: 42.2x trailing to 21.8x forward. The implied earnings growth baked into that ratio is roughly 93% over twelve months for the median name in the basket. That seems aggressive. It is also, broadly, what consensus expects given current capex flow-through.
Why the Gap Is Wider for AI Right Now
Earnings revisions across the AI complex have been running well above historical norms. FactSet's May 1 update shows information technology net profit margins at 29.1% in Q1 2026, up from 25.4% a year earlier — the highest level since the firm began tracking the metric in 2009. Eighty-four percent of S&P 500 names beat consensus EPS estimates by an average magnitude of 12.3%, against a five-year average beat of 7.3%.
Translation: analysts were too low going into the quarter, the companies cleared the bar by a wide margin, and the forward estimates are still catching up.
When the denominator is moving up faster than the numerator, the forward P/E falls without the stock falling. This is the mechanism that confuses most casual observers of the AI trade. The chart of the trailing multiple keeps drifting higher. The forward multiple keeps drifting lower. Both are true. They are measuring different things.
The behavior is mathematical, not narrative. If a stock trades at $100 and earned $2 last year, the trailing P/E is 50x. If consensus expects $5 next year, the forward P/E is 20x. Nothing about that arithmetic depends on whether anyone is "bullish" or "bearish." It depends entirely on whether the $5 estimate shows up as actual reported earnings.
What Gets Missed When People Compare 42x to 152x
The dot-com peak comparison gets thrown around constantly. The number most often cited is Evercore ISI's observation that the dot-com "darlings" basket hit a median trailing P/E of 152x in March 2000. The AI Class today sits at 42.2x trailing — roughly 3.6x below that peak.
But the more important difference is what was in the denominator.
In March 2000, 74% of the 207 internet companies tracked in Barron's now-famous "Burning Up" report had negative cash flow, with 51 likely to run out of cash within twelve months. Cisco at the peak traded around 196x earnings with $2.67 billion in net income. The denominators were small, fragile, or in many cases nonexistent.
Today, the five largest constituents of the AI Class basket — NVDA, GOOGL, MSFT, AMZN, TSM — account for 64.8% of the basket's combined market cap and generate hundreds of billions of dollars in annual net income between them. Tech sector net profit margins are at all-time highs. Eighty percent of the 35-name basket reports positive trailing earnings, and 77% have positive forward consensus EPS.
This does not make AI cheap. It makes the denominator real. A 42x multiple on a denominator that is itself growing in the low-to-mid teens compounds to something much closer to fair value within two or three years. A 152x multiple on a denominator that is shrinking to zero compounds to permanent capital impairment.
Same multiple, different denominator
A 42x multiple on a growing denominator and a 152x multiple on a vanishing denominator are mathematically different bets — the first compounds toward fair value as earnings catch up to price, the second compounds toward zero as the earnings base collapses beneath it. The multiple alone tells you almost nothing. What sits underneath it is the entire story.
What Investors Should Actually Watch
If forward P/E does most of the valuation work, then the things that move forward P/E matter more than the things that move trailing P/E. Trailing earnings are already in the books. Forward earnings are still being negotiated by analysts, companies, and capex commitments.
The three things worth tracking, in order of how much they move forward P/E:
- Earnings revisions. When analysts mark estimates higher, the denominator grows and forward P/E falls without the stock moving. When they mark estimates lower, the inverse happens — and stocks often fall on top of it, double-counting the move.
- Capex flow-through. Hyperscaler capital expenditures are now projected at roughly $700 billion in 2026 across Microsoft, Alphabet, Meta, and Amazon combined. That spend lands as revenue on the books of NVDA, AVGO, MRVL, ASML, TSM, VRT, GEV, ETN, and the rest of the semi and infrastructure chain. The forward P/E for those names already prices a healthy share of that flow-through.
- Concentration. The top five names in the basket represent 64.8% of total market cap. If those five names beat consensus, the basket's earnings grow faster than the median name does. If they miss, the opposite happens. Median P/E hides what is going on at the cap-weighted level.
Get the spreadsheet
Want to track this yourself? We built a copy-and-go AI Class P/E Monitor spreadsheet. Make your own copy in Google Sheets and update the inputs each week — same methodology, same band thresholds. Copy the spreadsheet
The Bottom Line
A 42x trailing P/E on the AI Class is not the same as a 152x trailing P/E on the dot-com class, and a 42x trailing is not the same as a 21.8x forward on the exact same basket reported on the exact same day. The trailing number tells you what last year's earnings cost. The forward number tells you what next year's are priced at. When earnings are growing fast — and right now, in this basket, they are — the gap between those two numbers is doing most of the work that observers attribute to the price. You do not have to believe analyst estimates to recognize that the spread itself is information. You just have to read the whole fraction, not only the top half of it.
Disclaimer: VTI & Chill provides financial EDUCATION, not personalized financial ADVICE. We are not licensed financial advisors. All content is for informational and educational purposes only. Past performance does not guarantee future results. Always do your own research and consider consulting a qualified financial professional before making investment decisions. All investing involves risk, including the possible loss of principal.