The Bottom Line
The AI Class P/E Monitor sits at 44.9x trailing and 21.2x forward this week — basically flat WoW. But the median number is the least interesting thing on the page. Inside the same 35-name basket, Hyperscalers trade at 14.2x forward while Software/Data trades at 62.6x — a 4.4x gap inside one "theme." When someone tells you "AI is a bubble" or "AI is reasonably valued," they are almost always talking about one compartment of the basket and pretending it is the whole thing. The chill take: stop arguing about whether "AI is expensive." Pick the segment, look at its forward multiple, and decide whether the embedded growth assumption is one you would bet your own money on.
Key Metrics This Week
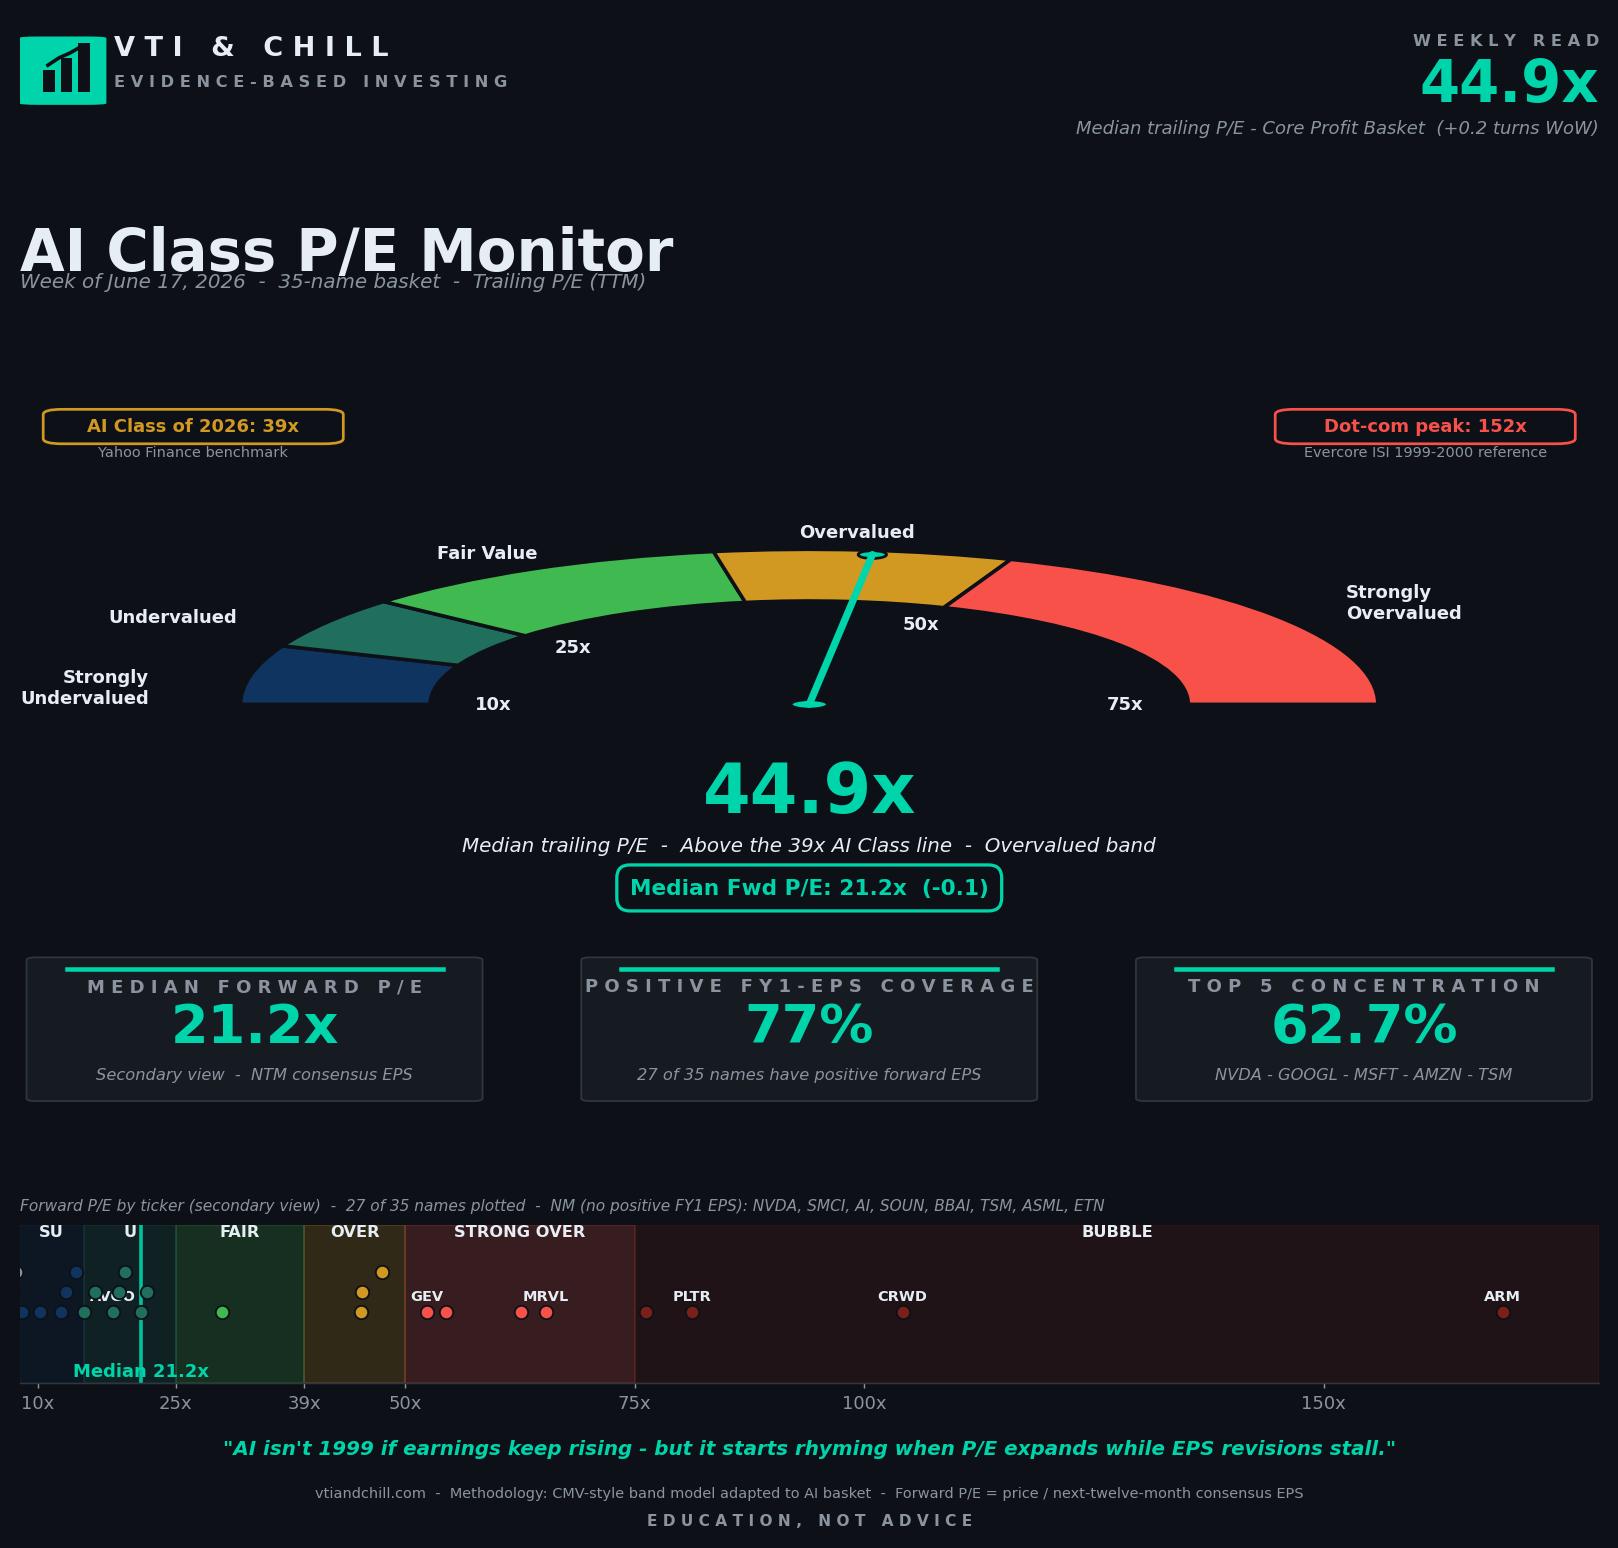
- Median trailing P/E 44.9x — still squarely in the Overvalued band, well below last month's 51.3x peak.
- Median forward P/E 21.2x — roughly in line with the S&P 500 forward (~22.5x) for the second straight week.
- Positive FY1-EPS coverage 77.1% — 8 of 35 names excluded from the forward median, including NVDA for the 4th consecutive week.
- Top-5 concentration 62.7% — eased -1.3 pp as smaller names participated; AVGO re-entered top 5.
- Biggest WoW mover: ARM — forward P/E jumped +39 turns (130x → 169.5x) on a +30% price rally with essentially no estimate revision.
- Segment dispersion: 14.2x to 62.6x forward — Hyperscalers cheapest, Software/Data richest, with everything in between.
Get the full data set
The complete spreadsheet behind this week's monitor — 35 names, 6 segments, all the raw quotes and estimates with forward P/E formulas. Open it and trace the math for any number on the chart.
Open the spreadsheet →What This Means For You
- Stop treating "AI" as one position. If you own a thematic AI ETF, look up its top 10 holdings and the segment weights. The 4x forward P/E gap inside our basket means the fund is making a segment bet you may not have noticed.
- If you index, you already own the cheap part. Hyperscalers at 14x forward are most of the market-cap weight in the basket. A VTI or S&P 500 index already gives you the lowest-multiple piece of the AI thesis without having to pick which compartment to load up on.
- Multiple expansion without estimate revision is a yellow flag, not a buy signal. ARM's +39 turn forward P/E expansion this week happened because price went up while the FY1 EPS line stayed put. That is not "the market getting smart about ARM." That is the multiple doing the work, and the math gets harder from here.
- Watch the segment dispersion, not the headline. A widening gap between Hyperscalers and Software/Data tells you more about market positioning than a single median number can.
Why The "AI Basket" Median Lies To You
Every week, somebody publishes a chart of "the AI sector's P/E ratio" as a single number. CNBC does it. Wall Street strategists do it. Even sober research notes do it. The implicit message is that "AI" is one asset class with one valuation, and that valuation is either reasonable or it is not.
The data inside the AI Class P/E Monitor this week tells a different story.
Take the six segments and line them up by forward P/E, cheap to expensive: Hyperscalers/Cloud at 14.2x, Model/App Layer at 20.1x, Servers/Networking at 20.3x, Power/Infra at 30.8x, Semis at 54.5x, Software/Data at 62.6x.
The cheapest segment is cheaper than the S&P 500's forward P/E, which sits around 22.5x per FactSet Earnings Insight. The most expensive segment is roughly 3x the index and nearly 4.4x the cheap segment.
When a strategist says "AI is overvalued" and shows a single median, they are usually showing you something close to 21x forward — the basket median. That number is so close to the broad market that it carries no real information. The interesting question is not "Is AI expensive?" — it is "Which AI is expensive, and how much earnings growth would you have to believe to justify it?"
Hyperscalers at 14.2x forward are pricing in roughly broad-market earnings growth. Software/Data at 62.6x forward needs another 2-3 years of compounding revenue growth at 25-40% just to grow into a reasonable multiple. Those are completely different bets, hidden under one ticker bucket.
The Mechanics: How ARM Got A +39-Turn Multiple In Five Trading Days
ARM did something this week that deserves its own teaching moment. Forward P/E went from 130.4x to 169.5x — a +39 turn move, the biggest single-name expansion in the basket since the monitor began.
How does that happen? Two ways. Either earnings estimates get cut hard, or price goes up faster than estimates can catch up. This week was the second one.
ARM's price rallied roughly +30% WoW. FY27 EPS consensus barely moved. Run the math: forward P/E equals price divided by FY1 EPS. If price moves up 30% and the denominator stays flat, the multiple expands by 30%. That is exactly what happened: 130.4 × 1.30 ≈ 169.5. No estimate revision required.
This is one of the most-misunderstood mechanics in equity investing. A stock can become "more expensive" without any change in the underlying business. The price moves; the estimate has not yet caught up; the multiple jumps. Whether that is sustainable depends entirely on whether the next round of estimate revisions catches up to the price, or whether the price drifts back to where estimates already are.
History on this question is brutal. Multiple expansion without subsequent earnings catch-up is one of the most reliable predictors of forward underperformance. Research from Dimensional and others shows that valuation premiums get unwound on roughly 3-5 year horizons unless the embedded growth shows up in the cash flows. The market is patient about waiting for earnings; it is not infinitely patient.
That is not a call on ARM. It is a calibration on what 169x forward actually requires. The company has to deliver enough earnings growth to make 169x look reasonable in retrospect. That is a high bar.
Concentration Eased — Quietly, And It Matters
Underneath the headline multiples, something subtle but useful happened this week. Top-5 market cap concentration dropped -1.3 pp to 62.7%. AVGO re-entered the top 5 (displacing one of the mega-caps from prior weeks).
The reason this matters: last week, when the basket was selling off harder, concentration rose because smaller names fell faster than mega-caps. That is the classic flight-to-safety mechanic — and it is also the mechanic that quietly leaves index investors more concentrated in five stocks than they realize.
This week, the opposite happened. Smaller and mid-cap names rallied harder than the giants. Concentration eased. AVGO bounced back into the top 5. Several semis caught a bid. This is what a healthier, broader recovery looks like.
The lesson tucked inside that 1.3 pp move: concentration is a function of dispersion in returns, not a static portfolio property. The same fund can be "diversified" in a calm market and "concentrated" in a panicked one — without anyone trading a single share. If you are buying the AI Class through a thematic ETF or a market-cap-weighted index, your real exposure is set by what the rest of the market is doing this week, not by what the prospectus said when you opened the position.
The fix is the same as it always is: own broad, low-cost, market-cap-weighted exposure with a clear understanding of where your concentration sits, and resist the urge to "rotate into the cheap segment" or "trim the expensive one" based on a single week's read. The discipline is the strategy.
"AI isn't 1999 if earnings keep rising — but it starts rhyming when P/E expands while EPS revisions stall."
That is the standing punchline of the monitor, and it applies word-for-word this week. The basket median forward P/E held flat at 21.2x. Breadth held at 77.1%. The expansion-without-revisions pattern showed up in one ticker (ARM, on a single-week price spike), not across the basket. The rhyme with 1999 requires both ingredients together. Neither showed up this week.
Sources & Methodology
- AI Class P/E Monitor data and methodology — weekly run by VTI & Chill, 35 names across 6 AI segments, NTM rule = first fiscal year ending at least 6 months out from the run date. Visit vtiandchill.com for the full archive.
- S&P 500 trailing and forward P/E reference — Multpl S&P 500 P/E; current quarterly earnings insight from FactSet Earnings Insight.
- Multiple expansion vs. earnings catch-up research — see Dimensional's research insights on valuation premiums and forward returns.
- Long-term equity premium and diversification mechanics — see Of Dollars And Data and A Wealth of Common Sense for foundational essays on concentration risk in market-cap-weighted indexing.
- Dot-com peak comparison (152x at peak) — Evercore ISI via Reuters.
Disclaimer: VTI & Chill provides financial EDUCATION, not personalized financial ADVICE. We are not licensed financial advisors. All content is for informational and educational purposes only. Past performance does not guarantee future results. Always do your own research and consider consulting a qualified financial professional before making investment decisions. All investing involves risk, including the possible loss of principal.