The Bottom Line
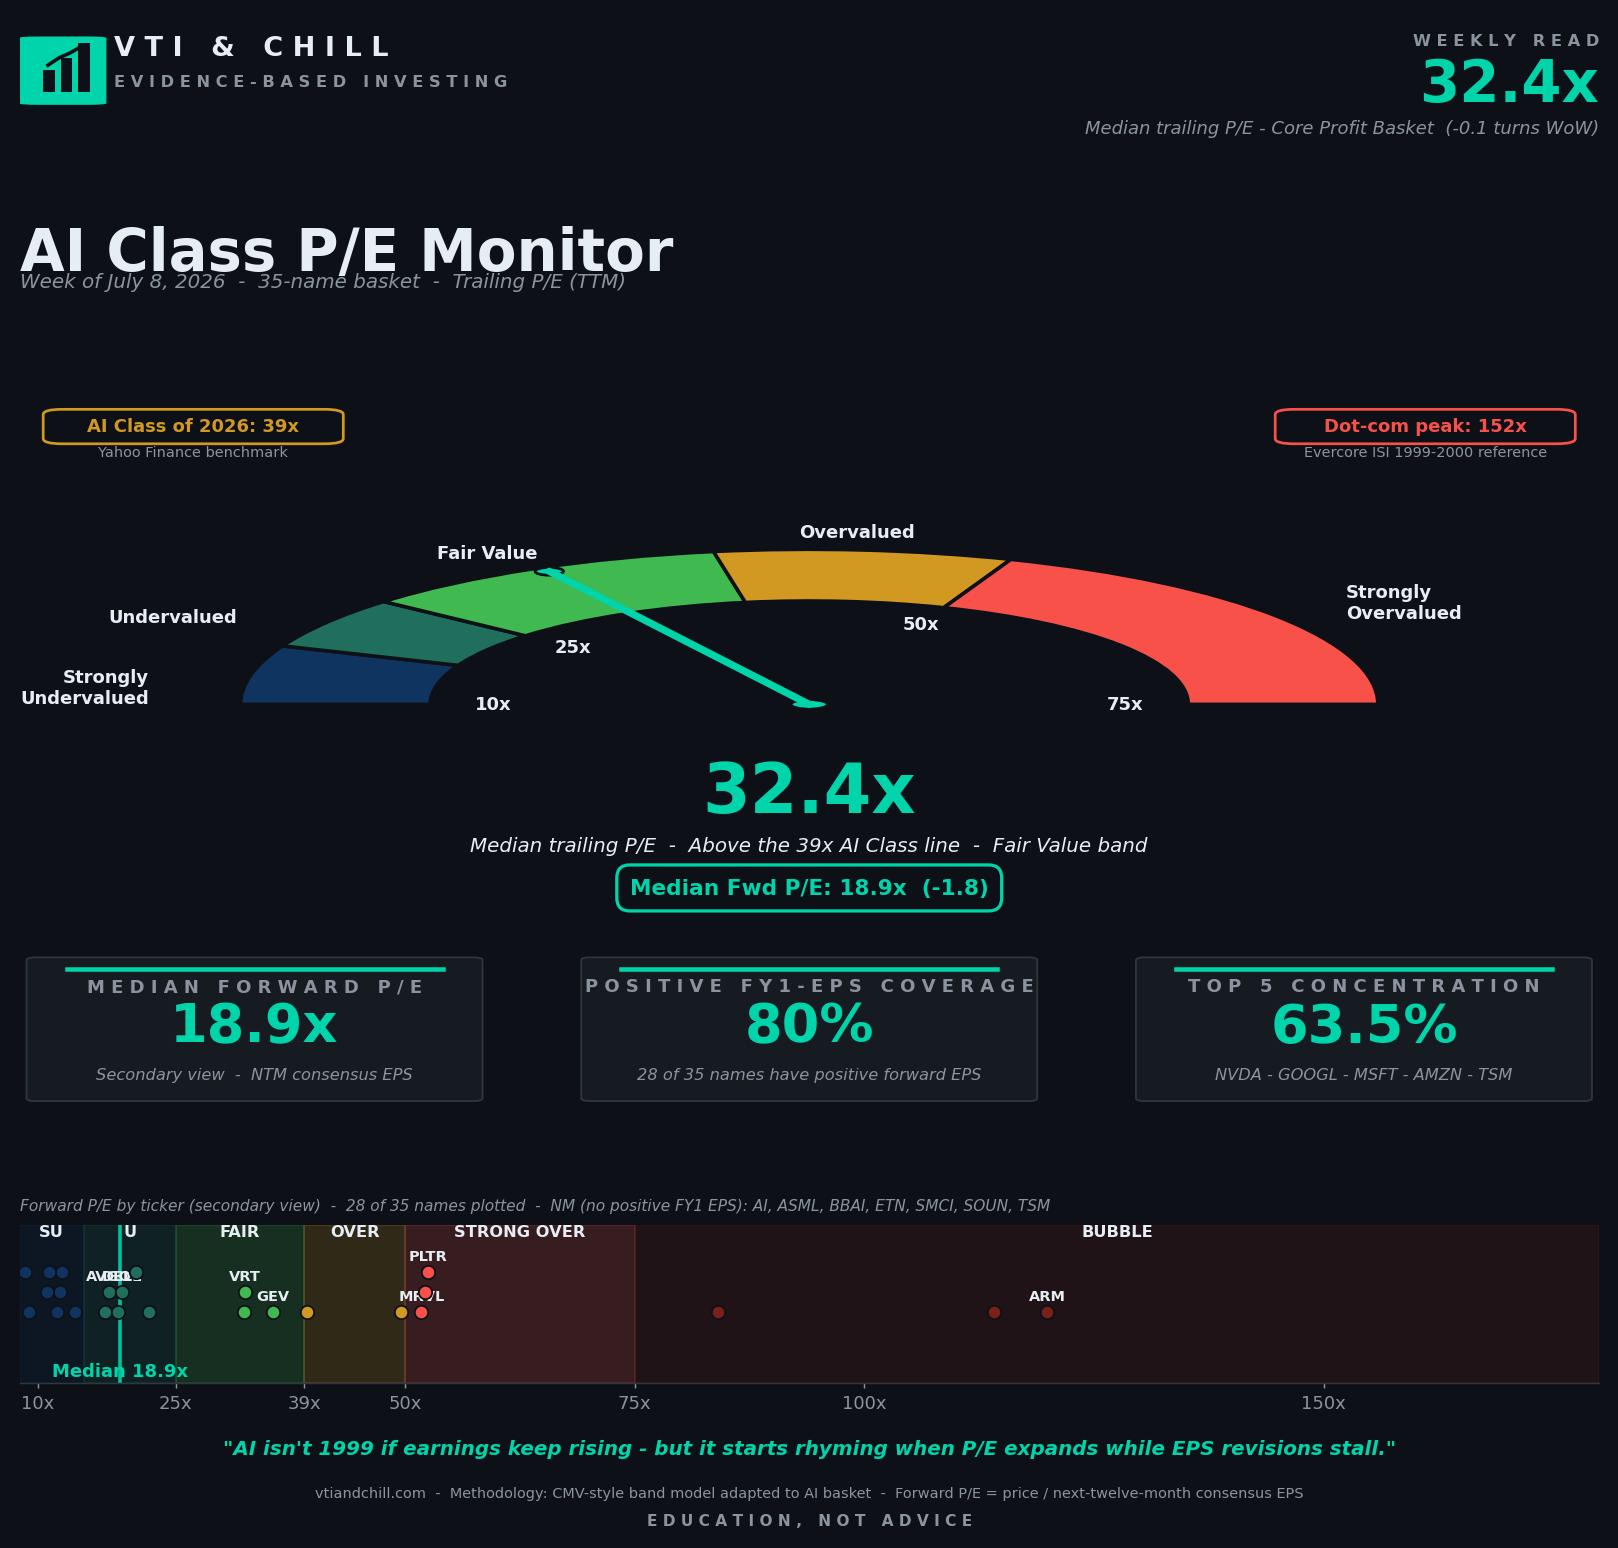
For the first time in this monitor's 9-week history, the AI Class trades cheaper than the S&P 500 on forward P/E. The Core Profit Basket now sits at 18.9x forward, roughly 5 turns below the S&P 500's ~24x forward multiple. Median trailing P/E held essentially flat at 32.4x, still just below the S&P 500 trailing at ~31x. The mechanism this week was pure denominator refresh: analyst FY26 EPS estimates for AMD jumped ~108% week-over-week, GE Vernova ~64%, AppLovin ~52%. Prices barely moved. The multiple fell because the numbers underneath moved. If you were told six months ago that the AI Class would trade below the market on forward earnings, you would have assumed a crash. Instead, it was an earnings-revision cycle doing exactly what earnings-revision cycles are supposed to do.
Key Metrics This Week
- Median trailing P/E 32.4x — essentially flat (-0.1 turns). Roughly at the S&P 500's ~31x trailing multiple.
- Median forward P/E 18.9x — down 1.8 turns, the largest single-week forward compression in the monitor's 9-week history. Now below the S&P 500's ~24x forward multiple.
- Biggest forward P/E compressions — AMD (-44.3%), GEV (-39.3%), APP (-34.1%). All EPS-revision-driven, not price-driven.
- Biggest forward P/E expansions — AVGO (+4.6%), HPE (+1.1%), NVDA (+1.0%). Price-driven, minimal estimate changes.
- Segment reversal — Semis forward fell from 37.6x to 25.1x. Software/Data from 73.2x to 52.2x. Model/App from 22.4x to 16.6x.
- Top-5 concentration 63.5% — NVDA, GOOGL, MSFT, AMZN, TSM. Up 0.8 pp but same composition.
Get the full data set
The complete spreadsheet behind this week's monitor — 35 names, 6 segments, all the raw quotes and consensus estimates with forward P/E formulas. Open it and trace the math for any number on the chart.
Open the spreadsheet →What This Means For You
- Watch forward P/E. Trailing P/E tells you where the market was six months ago. Forward P/E tells you what analysts believe about the next 12 to 18 months. Both matter, but the forward number is closer to what actually drives price action.
- Understand that EPS revisions are a first-order variable, not a footnote. When AMD's FY26 estimate jumps 108% in a week, the forward multiple compresses regardless of what the stock does. That is the numerator moving, not the price.
- Do not confuse "cheap vs. the S&P" with "cheap vs. history." The AI Class forward multiple is below the S&P 500 today, but it still sits above the long-run S&P 500 median of ~15 to 16x since 1990. "Reasonable" is not the same as "bargain."
- Own the whole market. VTI holds all 35 names in this basket at market-cap weight, plus 3,700 others. You participate in the AI trade without needing to guess which segment gets the next EPS revision.
- Ignore the segment leaderboard. It moves too fast. Software led the multiple expansion in June. Semis led the compression in July. Both are in your fund.
Forward P/E Is A Bet, Not A Fact
Trailing P/E is arithmetic. You take the current price, divide by the last 12 months of reported earnings, and you get a number. It happened. It is audited. There is no room for interpretation.
Forward P/E is a bet. You take the current price and divide by a consensus estimate of the next 12 months of earnings. The estimate is an opinion, or more accurately, an average of opinions from sell-side analysts who have every incentive to lean optimistic (see the classic Duke / Fuqua working paper on analyst forecast bias). The consensus can be wrong. It is often wrong. But it is the number the market is actually pricing on, because prices anchor on expected future cash flows, not reported past ones.
The gap between trailing and forward P/E tells you what the market believes about earnings growth. The AI Class Core Profit Basket trades at 32.4x trailing and 18.9x forward. That gap implies analyst expectations of roughly 70% aggregate earnings growth over the next fiscal year. That is a very specific bet. If earnings deliver, the forward number is close to right. If earnings miss, the forward number was a story.
The S&P 500 trades at 31x trailing and 24x forward, implying ~30% aggregate growth (FactSet Earnings Insight). Lower gap, lower bet. That is why forward multiples on high-growth baskets look cheap and forward multiples on mature indexes look expensive by comparison. The forward math rewards growth expectations. The trailing math does not.
None of this means the AI Class is a screaming buy at 18.9x forward. It means you should read the forward number as "here is what needs to be true for this multiple to make sense" rather than "here is what things cost."
The Denominator Did All The Work This Week
Between last Wednesday and this Wednesday, the AI Class Core Profit Basket's median forward P/E fell from 20.7x to 18.9x. That is the biggest single-week forward compression in the monitor's 9-week history. Nothing crashed. The S&P 500 was roughly flat. NVDA closed at $198.05 versus $196.05 a week earlier. AMD closed at $507.91 versus $554.51. Prices barely moved.
What moved was E. Three examples from this week's dataset:
AMD. Prior-week NTM EPS was ~$9.51. This week's estimate refreshed to ~$15.68. At $507.91, forward P/E fell from 58.3x to 32.4x. A 44.3% compression driven by the estimate coming up, not the stock coming down.
GE Vernova. NTM went from ~$19.42 to ~$30.42. Share price actually fell from $1,137 to $1,083, but forward P/E compressed from 58.6x to 35.6x anyway. The denominator overwhelmed the numerator.
AppLovin. NTM from ~$15.21 to ~$23.15. Forward P/E from 33.6x to 22.1x.
This is the mechanic that lets a "39x AI Class" story from three months ago turn into a "19x forward" reading today without a bubble popping. When analysts revise EPS estimates upward, forward multiples compress mechanically.
The inverse happens too. If AMD's next guide disappoints and analysts cut FY26 back to $9.50, forward P/E snaps back to ~58x overnight without a share changing hands. The forward number is only as good as the estimates behind it.
The Reference Frame Matters More Than The Level
There are three P/E baselines worth keeping in your head.
S&P 500 long-run median (~16x trailing). Since 1990, the S&P 500 has traded at a median trailing P/E of roughly 16x per Multpl historical data. That is the calibration for "what the average dollar of US corporate earnings has historically cost." Not a target, just a reference.
S&P 500 today (~31x trailing, ~24x forward). The current index sits about 2x above its long-run trailing median. That elevation has persisted for years, driven partly by mega-cap tech's rising share of the index and partly by low structural interest rates. See Aswath Damodaran's ongoing work on equity risk premiums. "Expensive by history, normal by recent standards" is a fair read.
AI Class today (32.4x trailing, 18.9x forward). The trailing multiple is roughly at the S&P 500 level. The forward multiple is below it. The gap between the two implies a growth premium the market is pricing in.
Dot-com peak reference (152x trailing on the highest-fliers, per Evercore ISI). The often-cited comparison via Barron's / Evercore ISI. At the March 2000 peak, the top dot-com names traded at multiples 4 to 5x what today's AI Class trades at. Not remotely close.
Use these together. The AI Class is expensive relative to the long-run S&P median (2x). It is roughly at the current S&P (1x). It is a fraction of the dot-com peak (0.2x). All three statements are true simultaneously. Which frame matters depends on what question you are asking.
What Comes Next Is Not Predictable, But It Is Bounded
Two things can happen from here. Either EPS revisions keep coming in hot and the forward multiple stays reasonable, or revisions stall and the multiple has to expand back up to keep the story intact. The market is pricing option one. Historically, that bet works about as often as it does not in any given 12-month window (see Vanguard research on active-management outcomes).
The AI Class is not going to stay at 18.9x forward. It will either move down toward the trailing multiple as revisions decelerate, or up as EPS expectations catch up to the price and the growth premium moves elsewhere. Both outcomes are ordinary. Neither requires a crash.
The chill investor does not need to know which outcome arrives. Index ownership captures both. VTI holds every one of these names in its 3,700-plus-name basket at market weight. You do not need to be right about AMD's FY26 guide to participate in the outcome.
"AI isn't 1999 if earnings keep rising — but it starts rhyming when P/E expands while EPS revisions stall."
That is the standing punchline of the monitor. This week reinforced the first half again. Forward P/E fell nearly two turns because earnings estimates for FY26 got revised sharply higher, not because prices collapsed. Coverage held at 80%. If the earnings side keeps compounding, the rhyme with 1999 does not close. When revisions stall and prices hold, that is when the reference frame changes.
Sources & Methodology
- AI Class P/E Monitor data — internal weekly run by VTI & Chill, 35 names across 6 AI segments, NTM rule = first fiscal year ending at least 6 months out from the run date. Visit vtiandchill.com for the full archive.
- S&P 500 historical P/E — Multpl.
- S&P 500 forward P/E and earnings insight — FactSet Earnings Insight.
- Analyst forecast bias — Duke / Fuqua working paper.
- Dot-com peak reference — Barron's / Evercore ISI.
- Equity risk premium framework — Aswath Damodaran, NYU Stern.
- VTI fund composition and holdings — Vanguard.
- Vanguard research on active-management outcomes — Vanguard Research.
Methodology note: 35-name AI basket; Core Profit Basket = names with positive FY1 consensus EPS. NTM rule applies the first fiscal year whose period end is at least 6 months after the run date. Forward P/E = price / next-twelve-month consensus EPS. Trailing P/E = price / TTM EPS. Median is the headline because the basket is right-skewed by a handful of very-high-multiple names. Segment membership: Semis (NVDA, AMD, AVGO, MRVL, MU, TSM, ASML, ARM); Servers/Networking (SMCI, DELL, HPE, ANET, CSCO); Hyperscalers/Cloud (MSFT, GOOGL, AMZN, META, ORCL); Software/Data (PLTR, SNOW, DDOG, MDB, CRM, NOW, CRWD); Power/Infrastructure (VRT, ETN, GEV, CEG, NRG); Model/App (AI, PATH, SOUN, BBAI, APP).
Disclaimer: VTI & Chill provides financial EDUCATION, not personalized financial ADVICE. We are not licensed financial advisors. All content is for informational and educational purposes only. Past performance does not guarantee future results. Always do your own research and consider consulting a qualified financial professional before making investment decisions. All investing involves risk, including the possible loss of principal.