The Bottom Line
The 35-name AI basket compressed 4.4 turns of trailing P/E in a single week. Median TTM fell from 44.9x to 40.5x. Forward dropped 0.7 turns to 20.5x. The three richest names led the move down: ARM lost 15.8% of its forward multiple, Palantir lost 13.8%, Marvell lost 7.2%. Power and infrastructure names (GEV, VRT, DELL) ground modestly higher. This is not a crash, a top, or a vindication. It is mean reversion math doing what mean reversion math does after large dispersions. The lesson is older than AI itself: extreme P/E moves at the single-name level get unwound first, and the broad basket follows with a lag. If you own VTI, you already own the bigger names at index weights. If you own concentrated AI bets, this week is the mechanical reminder that the wider the move up, the harder the snap back.
Key Metrics This Week
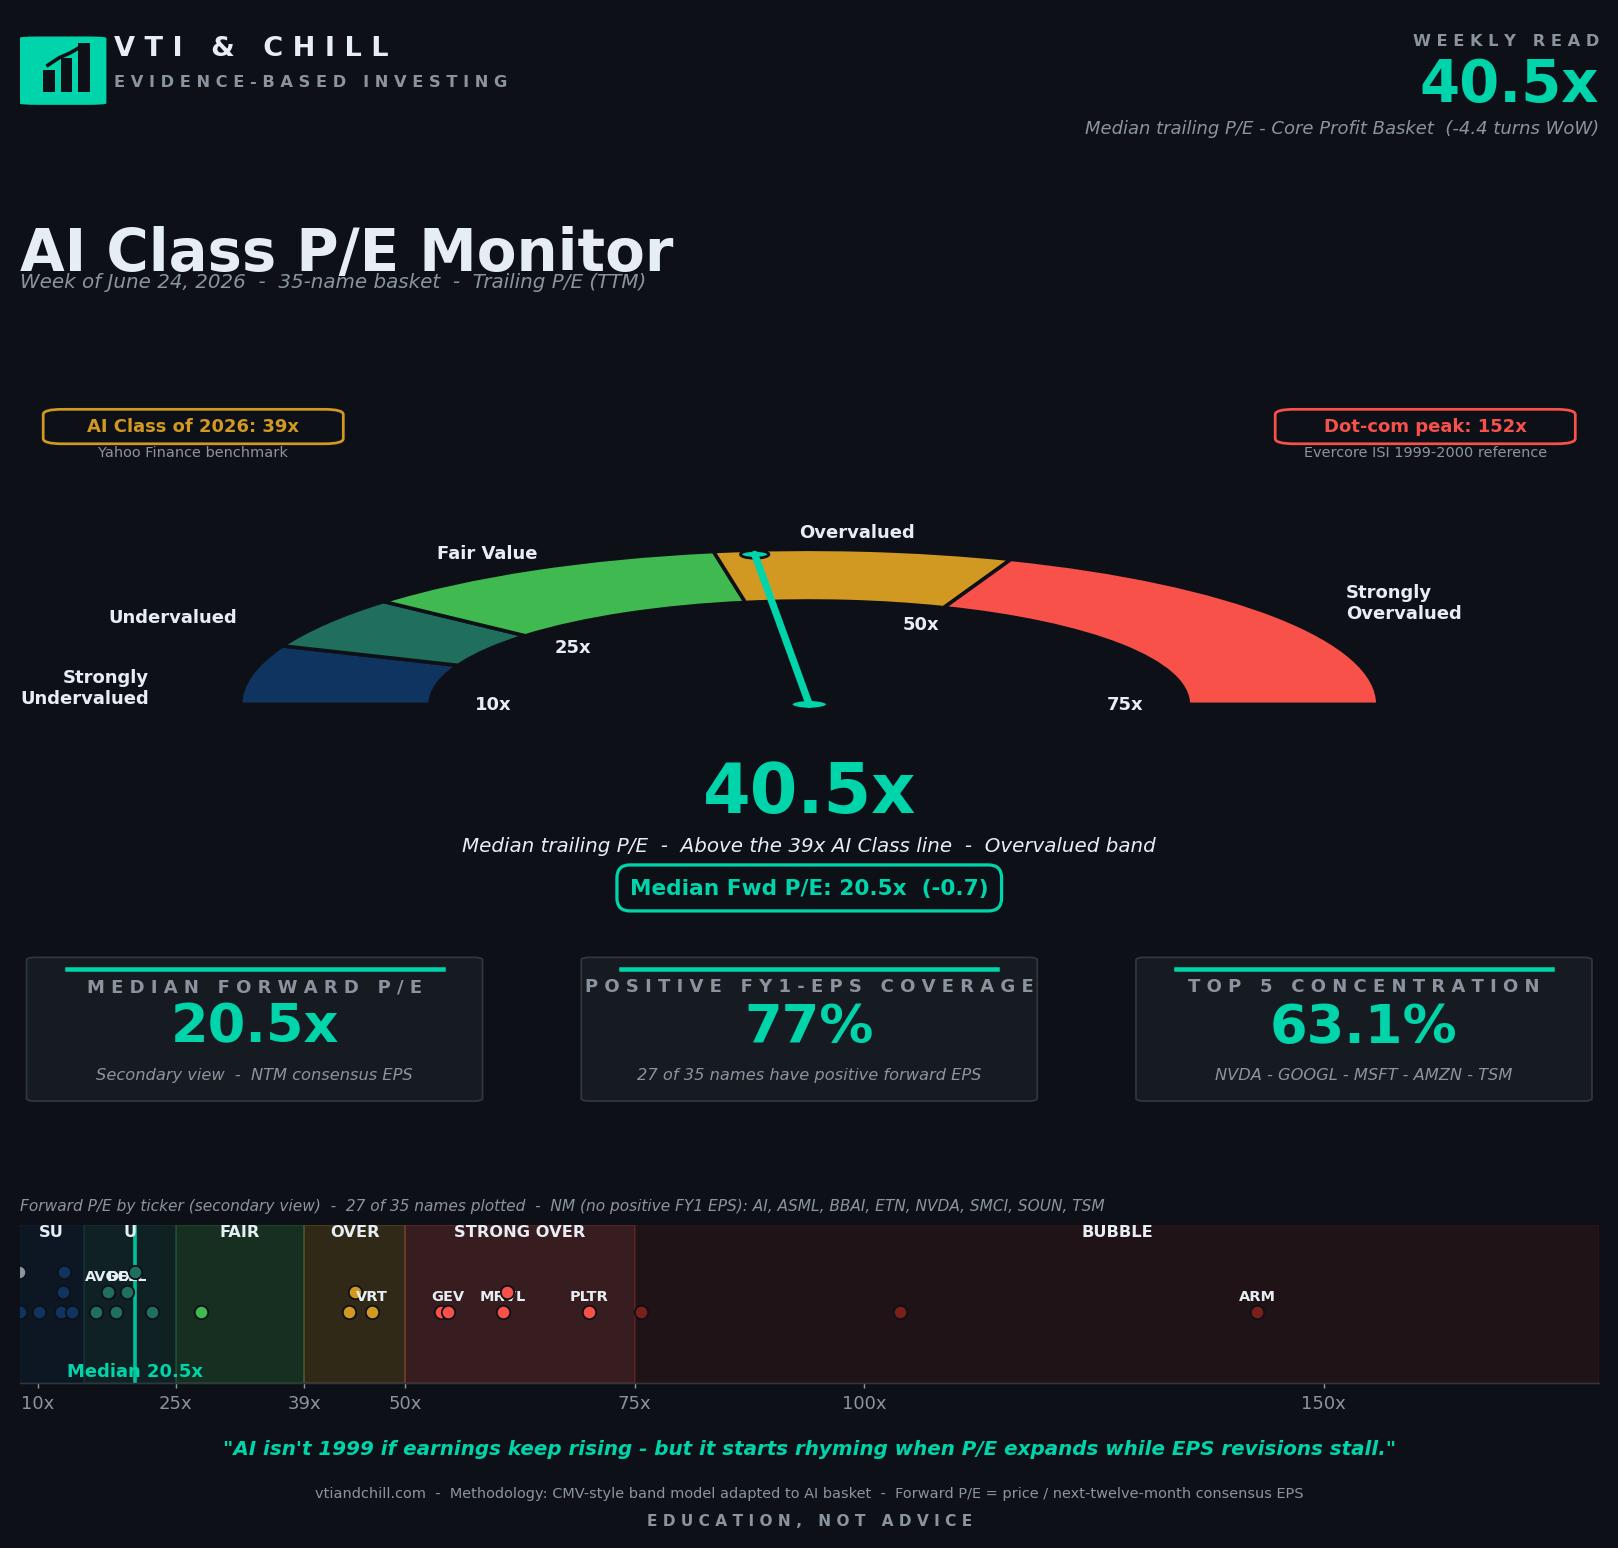
- Median trailing P/E 40.5x — cooled 4.4 turns in one week, the largest compression since the monitor began.
- Median forward P/E 20.5x — also down, but only 0.7 turns; the denominator (E) is doing more of the work than the numerator (P) collapsing.
- Positive FY1-EPS coverage 77% — flat WoW; same 8 names without positive forward EPS (NVDA, SMCI, AI, SOUN, BBAI, TSM, ASML, ETN).
- Top-5 concentration 63.1% — up 0.4 pp, still narrower than late-1990s tech.
- Biggest WoW compressors — ARM -15.8% forward P/E, PLTR -13.8%, MRVL -7.2%. The richest names took the hit.
- Biggest expanders — GEV +4.4%, DELL +4.5%, VRT +2.4%. Quiet infrastructure plays.
Get the full data set
The complete spreadsheet behind this week's monitor — 35 names, 6 segments, all the raw quotes and estimates with forward P/E formulas. Open it and trace the math for any number on the chart.
Open the spreadsheet →What This Means For You
- Resist the urge to recalibrate your strategy on a single weekly move. A 4-turn TTM compression is meaningful at the basket level and noise at the asset-class level. The trend you actually care about is the trajectory of earnings revisions, not weekly P/E wiggles.
- Audit your concentration. If you own VTI or VOO, the top 5 AI names are already in your portfolio at their natural index weight. Adding a concentrated AI sleeve doubles your exposure to the same five companies.
- Read forward P/E and trailing P/E together. Forward fell 0.7 turns. Trailing fell 4.4 turns. The gap means E is growing faster than P is falling. That is the healthy version of the picture.
- Don't time the next move. Mean reversion is real over decades and unpredictable over weeks. Stay broadly diversified, keep costs low, keep contributing.
- Educate yourself, don't tip yourself. A research weekly is not a buy or sell signal. The number is for context.
Mean Reversion Is Not A Forecast. It's A Gravitational Pull.
The phrase "mean reversion" gets tossed around like it predicts when something will fall. It doesn't. It describes a statistical tendency: extreme readings, on average, get pulled back toward a long-run average over time. The keyword is "on average," and the timeframe is "over time." Neither tells you what happens next Wednesday.
What mean reversion does tell you is where the gravitational center sits. For US large-cap trailing P/E, that long-run average is somewhere around 16x to 17x depending on whose dataset and which century you start in (Multpl.com). The S&P 500 today trades around 31x trailing — roughly double its long-run average. The AI Class of 2026 trades at 40.5x trailing. Compared to the long-run S&P average it's 2.4x rich. Compared to the dot-com 1999 peak of 152x trailing, it's a fraction of that euphoria (Evercore ISI via Reuters).
The math behind reversion is simple and the timeline is brutal. Research from Dimensional Fund Advisors going back to the 1920s shows that periods of above-average valuations are associated with below-average future returns over the following decade, but the relationship is noisy enough at one-year and three-year horizons to be unforecastable (Dimensional Insights). Translation: high P/E today probably means lower returns over the next ten years than the historical average. It does not mean a crash tomorrow.
That matters this week because the names that compressed most — ARM, PLTR, MRVL — were the most stretched names in the basket. ARM's forward P/E was 170x last week. Trees do not grow to the sky and forward multiples north of 100x almost never grow to 200x. The unwind started somewhere. This week, it started with the names where the unwind had the most slack to take up.
The Single-Name Move Versus The Basket Move
Here's a math principle that retail investors learn slowly and the hard way: an individual stock is not a basket. A 15% forward P/E compression on ARM doesn't translate to a 15% compression on your VTI. ARM is roughly 0.1% of VTI. A blowup in ARM costs your VTI position a rounding error. A 15% compression on the median basket member costs the basket about 15% of forward P/E.
The whole point of holding a broad index fund is to opt out of single-name volatility while staying long the asset class. The whole point of holding a concentrated AI ETF or a hand-picked sleeve of single AI names is to express a view that the basket-average outcome won't be enough. Both can be reasonable choices. They are not the same risk.
This week made the difference concrete. The S&P 500 was up modestly. VTI was up modestly. The AI basket compressed 4 turns. ARM compressed 16% of forward P/E. Five different outcomes, five different position sizings, five different risk profiles. Pick one and own it. Don't pick three and pretend they're additive.
What The 1990s Mean-Reversion Cycle Actually Looked Like
The dot-com analogy gets misused. People remember 152x as the peak and then a 78% drawdown over three years. What they forget is that the median S&P 500 P/E in 1995 was 16x (Multpl.com). The bubble inflated from 16x to 152x over five years before it deflated. The compression happened in stages. There were three meaningful drawdowns and recoveries in tech from 1995 to 1999 before the final peak (Hartford Funds).
Each interim drawdown looked like a 4-turn weekly compression in the median multiple. People sold. Some bought back in higher. The investors who did best were the ones who bought a Vanguard index fund in 1995, ignored CNBC for five years, and kept contributing.
The reason that strategy worked is structural. Index investing harvests the basket average. The basket average includes the companies that survive the unwind and the companies that became Cisco. Cisco peaked at $80 in March 2000. As of June 2026, Cisco is around $122 — twenty-six years later. An index fund holder who kept buying through that period beat the Cisco holder by orders of magnitude. The difference wasn't stock-picking skill. It was diversification doing what diversification does.
"AI isn't 1999 if earnings keep rising — but it starts rhyming when P/E expands while EPS revisions stall."
That is the standing punchline of the monitor, and it applies this week with a twist. P/E didn't expand — it compressed 4 turns. EPS revisions are still rising at the basket level. This is the version of the cycle the punchline is rooting for. Forward multiples falling because the denominator is growing. That is not a top. That is not a bubble. That is, for now, the boring middle.
Sources & Methodology
- AI Class P/E Monitor data — internal weekly run by VTI & Chill, 35 names across 6 AI segments, NTM rule = first fiscal year ending at least 6 months out from the run date. Visit vtiandchill.com for the full archive.
- S&P 500 historical and trailing P/E — Multpl S&P 500 P/E.
- Dot-com 1999 peak reference (152x) — Evercore ISI via Reuters.
- Valuation and forward-return research — Dimensional Fund Advisors Insights.
- Historical bubble cycle reference — Hartford Funds Market Perspectives.
- Mega-cap concentration framework — Vanguard Corporate Insights.
Methodology note: 35-name AI basket; Core Profit Basket = names with positive FY1 consensus EPS. NTM rule applies the first fiscal year whose period end is at least 6 months after the run date. Forward P/E = price / next-twelve-month consensus EPS. Trailing P/E = price / TTM EPS. Median is the headline because the basket is right-skewed by a handful of very-high-multiple names.
Disclaimer: VTI & Chill provides financial EDUCATION, not personalized financial ADVICE. We are not licensed financial advisors. All content is for informational and educational purposes only. Past performance does not guarantee future results. Always do your own research and consider consulting a qualified financial professional before making investment decisions. All investing involves risk, including the possible loss of principal.