The Bottom Line
The earnings refresh moved through the AI Class this week and cut the semiconductor segment's forward P/E from 53.9x to 37.6x, while software and data expanded to 73.2x on the exact same set of prices. Nothing about the businesses changed. The market simply got a look at another year of chip earnings, and Wall Street analysts started pricing off a bigger fiscal-year 2028 number. That is what a picks-and-shovels cycle looks like on a spreadsheet. The shovel makers book revenue when the GPUs ship; the software vendors recognize revenue as customers deploy, adopt, and expand. Semis get paid first, software gets paid over years, and the multiples flip accordingly. The Core AI Profit Basket now trades at a 32.4x trailing P/E, below the S&P 500's roughly 31x trailing multiple for the first time in the eight-week life of this monitor. That is not a mispricing. That is what happens when the earnings side of the ratio grows faster than the price side.
Key Metrics This Week
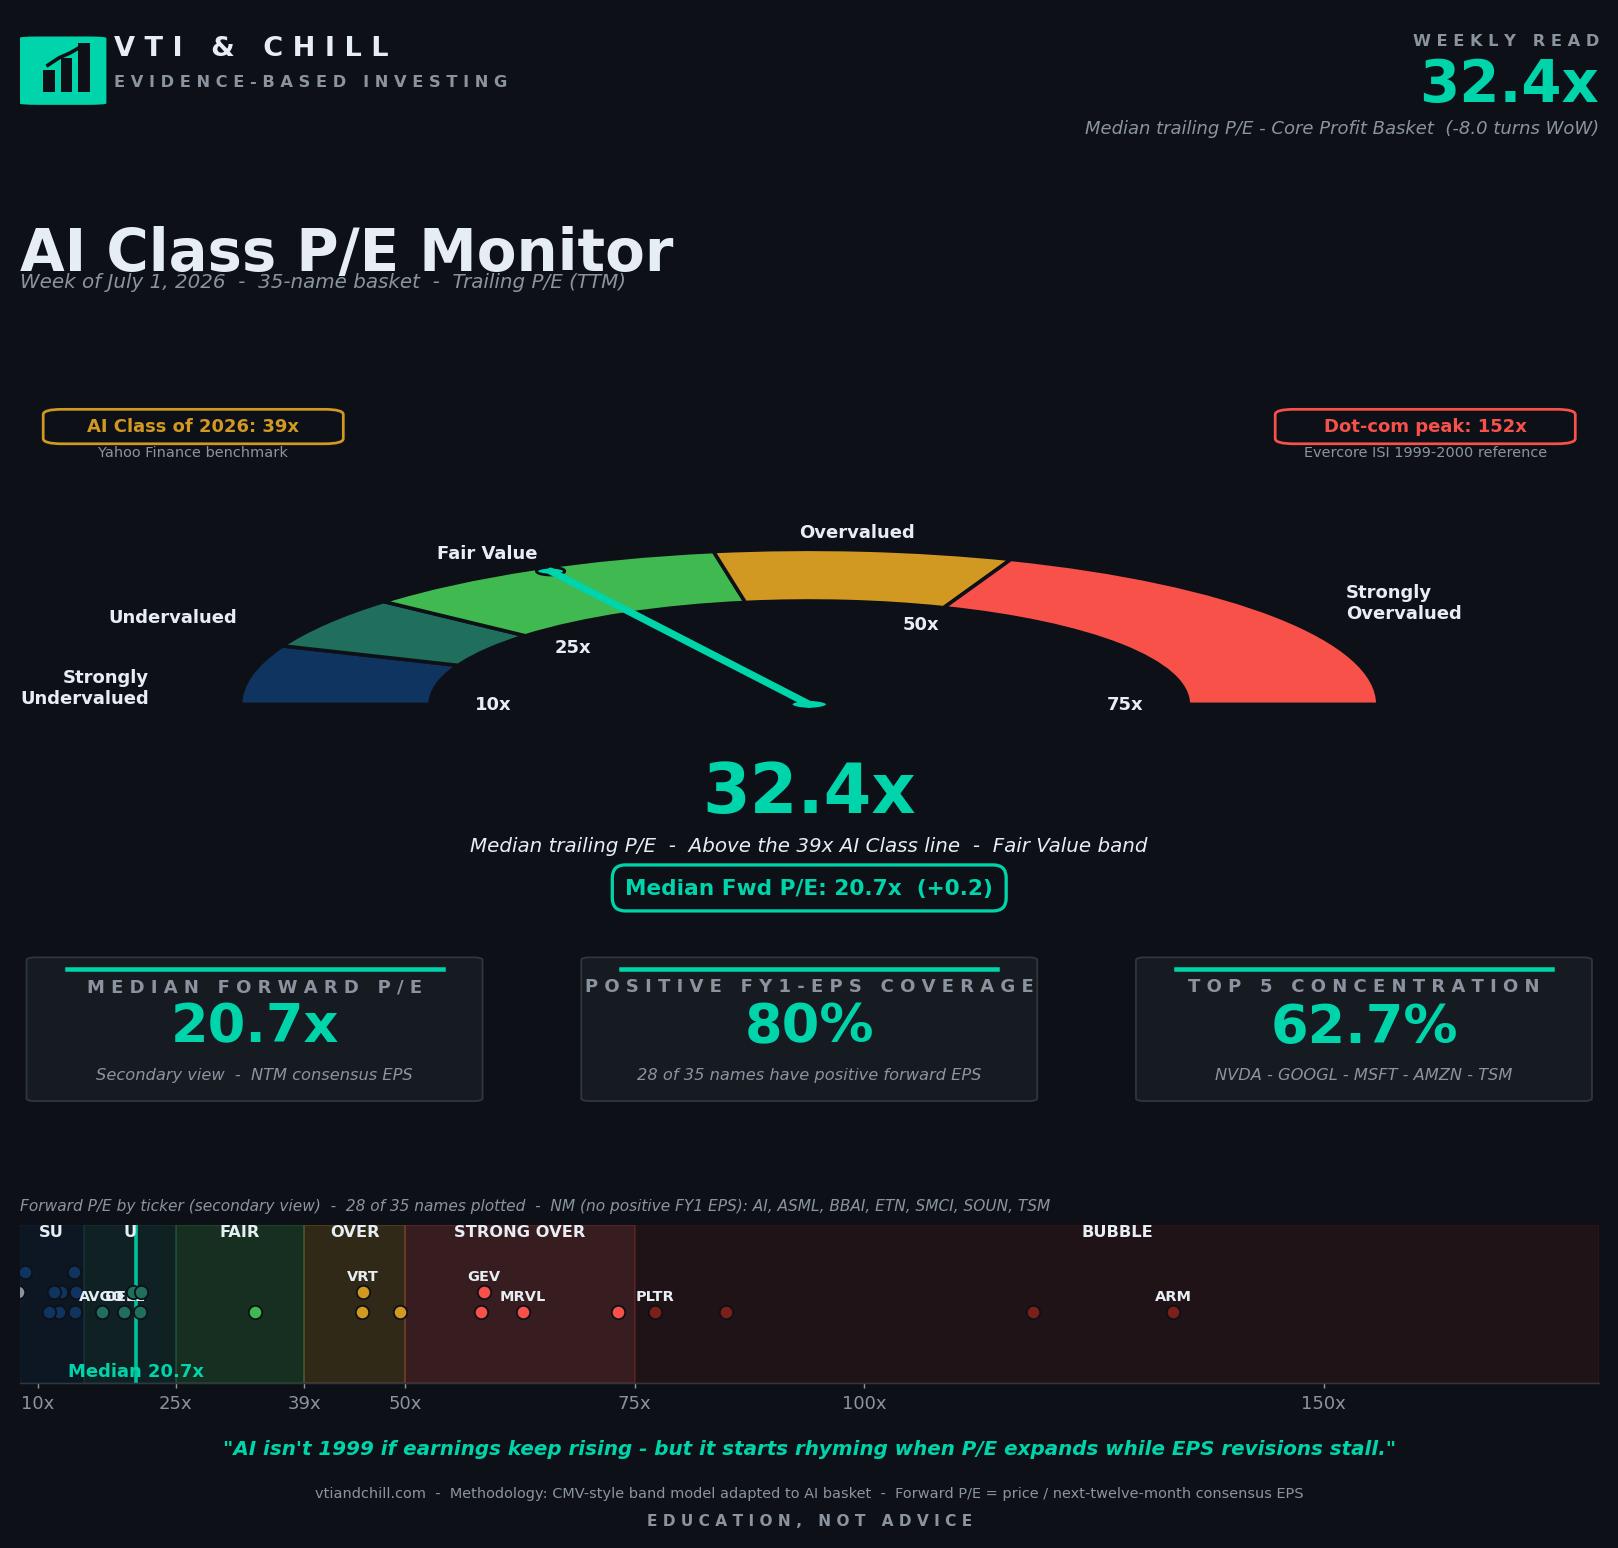
- Median trailing P/E 32.4x — down 8.0 turns in one week, the largest single-week compression this monitor has recorded. Now below the S&P 500's ~31x trailing multiple.
- Median forward P/E 20.7x — essentially flat (+0.2), meaning the trailing move came from the E side of the ratio expanding, not the P side falling.
- Semis segment forward P/E 37.6x — down 16.3 turns as NVDA's FY28 EPS estimate re-entered the median after five weeks missing.
- Software and Data segment forward P/E 73.2x — up 12.2 turns. APP +21.1%, DDOG +19.9%, CRWD +13.9% led the expansion.
- Positive FY1-EPS coverage 80% — up 2.9 pp on the estimate refresh.
- Top-5 concentration 62.7% — NVDA, GOOGL, MSFT, AMZN, TSM. Down 0.4 pp but still lopsided.
Get the full data set
The complete spreadsheet behind this week's monitor — 35 names, 6 segments, all the raw quotes and estimates with forward P/E formulas. Open it and trace the math for any number on the chart.
Open the spreadsheet →What This Means For You
- Read segment multiples before you read the headline number. A 32.4x trailing P/E on the aggregate hides a 37.6x semis segment and a 73.2x software segment. Those are different businesses at different points in the cash cycle.
- When trailing P/E drops eight turns in a week without a price move, the earnings denominator did the work. Ask what earnings just got recognized, not what price just changed.
- Understand which end of the picks-and-shovels supply chain you own. If you hold VTI, you own all of it in weighted proportion. If you hold thematic AI ETFs or single names, know whether you own the shovel makers or the software layer above them.
- Do not confuse a segment re-rating with a market call. Software's 73x forward multiple compresses if bookings miss; it holds if the revenue actually shows up. This is a story about when cash arrives, not whether it does.
- If you cannot explain in one sentence why a company's earnings are supposed to grow into its multiple, you are speculating on multiple expansion, not investing in a business.
The Picks-And-Shovels Cash Cycle
Peter Lynch popularized the picks-and-shovels framing decades ago as a way to invest in a boom without picking the boom's winner. During the California Gold Rush, most prospectors went broke. Levi Strauss and the pickaxe merchants got paid regardless of which claim panned out. The AI build-out has a similar structure, and the market is now paying different multiples for different rungs of that supply chain.
Here is the sequence, from the bottom of the stack to the top. Foundries like TSM etch silicon into wafers. Fabless designers like NVDA and AMD design the chips. Networking and server vendors like ANET, DELL, SMCI, and HPE turn those chips into racks. Hyperscalers like MSFT, GOOGL, AMZN, META, and ORCL install the racks in data centers and rent out compute. Software vendors like PLTR, SNOW, DDOG, CRWD, and CRM sell products that run on top of that compute. Application-layer companies like APP and AI sell finished experiences to end users.
Revenue recognition works in reverse order from the money flow. NVDA books chip revenue in the quarter the GPU ships to a hyperscaler. That is a hard revenue event, tied to a bill of materials, subject to gross margin analysis. The hyperscaler then depreciates that GPU over five to six years. The software vendors above them collect revenue as customers deploy, adopt, expand seat counts, and renew contracts. Palantir's revenue is recognized ratably over the contract term. Datadog's revenue expands as log volume grows.
That timing gap is why the multiples flip. Forward P/E equals price divided by next-12-month EPS. The semis segment gets an earnings tailwind first because the shovel-selling revenue lands first. The software segment carries a higher multiple because its earnings are further out and the addressable market is still expanding. Both can be right at the same time.
Why The Semis Multiple Compressed 16 Turns
The mechanical answer is that NVDA's FY28 analyst estimate became available this week, and the estimate is large. Wall Street analysts publish estimates for the next few fiscal years. As one fiscal year concludes and the calendar rolls forward, the "next twelve months" window slides to a new estimate. When that new estimate is materially higher than the prior year's, forward P/E compresses without any price move.
The Semiconductor Industry Association's most recent World Semiconductor Trade Statistics forecast projected 16.8% global semiconductor market growth in 2025. That is the environment analysts are extrapolating from when they write FY28 chip revenue models. NVDA's Q1 FY26 revenue was $44.1 billion, up 69% year-over-year per NVIDIA's Q1 FY26 press release. At that growth rate, FY28 EPS estimates get large in a hurry.
The lesson is not that semis are cheap. It is that forward P/E is a mechanical calculation, and the mechanic assumes the estimate is right. If the FY28 chip earnings show up, 37.6x will look reasonable in retrospect. If they do not, the multiple will re-expand as estimates get cut. The SPIVA scorecard shows that professional stock pickers miss more often than they hit; analyst estimates should be read with the same skepticism.
Why Software Expanded To 73x
The software and data segment moved in the other direction. APP forward P/E climbed 21.1% week-over-week; DDOG climbed 19.9%; CRWD climbed 13.9%. The mechanic is the mirror image. When earnings estimates for the next twelve months get revised down, or when prices climb faster than the estimate refresh, forward P/E expands.
A 73x forward multiple prices in years of compounding revenue growth. That is the market betting the AI adoption curve translates into ratable software revenue for a long time. It might. Palantir's most recent Q1 2026 revenue grew 39% year-over-year to $884 million per Palantir's earnings release. Datadog's most recent quarter grew 25% year-over-year per Datadog's earnings. Those growth rates are real. Whether they sustain long enough to justify 73x is the open question.
Charlie Munger's inversion applies here. Instead of asking whether software can grow into 73x, ask what has to go wrong for it to fail. Bookings decelerate. Net revenue retention drops from 120% to 105%. Enterprise IT budgets get cut. Model providers commoditize inference and squeeze the ecosystem. Any of those breaks the multiple. Owning the whole basket via a total-market index means the software segment can compress by half and the picks-and-shovels segment can carry the load. Owning software concentration means you are betting one direction.
"AI isn't 1999 if earnings keep rising — but it starts rhyming when P/E expands while EPS revisions stall."
That is the standing punchline of the monitor. This week reinforced the first half. Trailing P/E fell eight turns because earnings estimates got refreshed higher, not because prices collapsed. Forward P/E stayed flat. Positive-EPS coverage rose. If the earnings side keeps compounding, the rhyme with 1999 does not close. If estimates start getting cut and prices hold, that is when the reference frame changes.
Sources & Methodology
- AI Class P/E Monitor data — internal weekly run by VTI & Chill, 35 names across 6 AI segments, NTM rule = first fiscal year ending at least 6 months out from the run date. Visit vtiandchill.com for the full archive.
- Semiconductor market growth forecast — SIA / WSTS 2025 Forecast.
- NVIDIA Q1 FY26 earnings — NVIDIA Investor Relations.
- Palantir Q1 2026 earnings — Palantir Investor Relations.
- Datadog Q1 2026 earnings — Datadog Investor Relations.
- Active vs. passive win rates — SPIVA U.S. Year-End 2024 Scorecard.
Methodology note: 35-name AI basket; Core Profit Basket = names with positive FY1 consensus EPS. NTM rule applies the first fiscal year whose period end is at least 6 months after the run date. Forward P/E = price / next-twelve-month consensus EPS. Trailing P/E = price / TTM EPS. Median is the headline because the basket is right-skewed by a handful of very-high-multiple names. Segment membership: Semis (NVDA, AMD, AVGO, MRVL, MU, TSM, ASML, ARM); Servers/Networking (SMCI, DELL, HPE, ANET, CSCO); Hyperscalers/Cloud (MSFT, GOOGL, AMZN, META, ORCL); Software/Data (PLTR, SNOW, DDOG, MDB, CRM, NOW, CRWD); Power/Infrastructure (VRT, ETN, GEV, CEG, NRG); Model/App (AI, PATH, SOUN, BBAI, APP).
Disclaimer: VTI & Chill provides financial EDUCATION, not personalized financial ADVICE. We are not licensed financial advisors. All content is for informational and educational purposes only. Past performance does not guarantee future results. Always do your own research and consider consulting a qualified financial professional before making investment decisions. All investing involves risk, including the possible loss of principal.